Abstract
This study overviews development and validity of a pool of multiple-choice test items of geometry part of Mathematics for secondary level. A table of specifications was prepared and a pool of 48 multiple-choice type test items was developed from the test universe. The content validity and face validity of test items was determined with the help of a team of experts. Sample of the study was 488 students of class 10. After determining the validity and reliability through item analysis and quantitative and qualitative analysis of the test, it was concluded that 30 out of 48 items in the test were valid, reliable and suitable for measurement of the learning achievements in the course. Therefore, these items are useful in the boards of examinations for 9th class in Punjab (Pakistan).
Key Words
Achievement Test, Difficulty Power, Discrimination Power, Item Analysis, Reliability, Validity
Introduction
The history of formal student achievement assessment starts in 1838 when American New York State started it as a test of truth. The period from 1840 to 1875 recognized numerous types of tests in the history of American educational testing. Formal oral testing was replaced by written examinations and written testing was replaced by standardized examinations (Clements, 2007). The tests of achievement have therefrom become a specific component of the oral and written examinations to confirm the learning and prescribed material (Donald, 2013). These tests have set of rules in the design of construction. Ideally, tests should be standardized and have their own norms for their interpretation of scores during analysis (Mullis et.al., 2007).
The procedure of standardized tests is difficult, expensive and time-consuming task. Standard procedure includes; selection of universe of test, setting of testing objectives, decision about the items’ format, preparation of table of specifications, item bank construction, validity determination of items, pilot testing of items, analysis of pilot testing data and improvement of defective/ poor items in the light of analysis of all items, final try out of improved items and analysis of final try out data (Roid, 2012). Item analysis can be analyzed qualitatively in terms of their content and appearance, which includes the construction of face and content validity. Quantitative analysis of test items includes the measurement of item difficulty, distractor effect and items discrimination. (Rudner, 2011). Quantitative Item analysis procedure includes evaluation of difficulty level, discrimination level and distractor effect of each item of the test (Runder, 2011). Item difficulty indicates the proportion of correct and incorrect responses regarding an item. (Hulin, Drasgow & Parsons, 2013). An item having difficulty range between 0.20 to 0.80 is considered suitable. Discrimination level of an item is quality of an item that explains the power of an item to differentiate between high achievers and low achievers (Kelly, 2014). Ideally, an item having discrimination power in upper positive limits is always appreciated and an item having statistical value of discrimination power minimum to 0.30 is suggested for rejection (Roid, 2012).
In general, development and validation of tests for use of teachers in education adopting a standardized procedure is taken difficult. The institutions do not have resources in the form of money, time and trained staff to develop valid and reliable tests that can be used for a specific period of time (Akhter & Bahoo, 2015; Akhtar, 2015; Munir, 2016). The procedure of change in curriculum also discourage evaluators to use teacher made tests. But, researchers in the field can
do this laborious job. Otherwise, testing organizations can hire such technical staff on payment that standardized tests can be provided in institutions to improve the quality of assessment. Therefore, the present study was conducted to develop and validate a pool of items for evaluation of learning achievement of students in the Geometrical part of mathematics for secondary class. This is helpful for examination authorities to select some items for quality assessment of students.
Research Methodology
By purpose this study
was research and development and by method this study followed the procedure of
survey method in which standard procedure of test validation was adopted. In
this study; text book of mathematics for 9th class; English medium
taught in Punjab province was used for construction of tests items. Test items
covered first three levels of cognitive domains and was administered to 10th
class at the start of commencement of classes in new session.
Population and Sampling
All
students of 10th grade of English medium schools in Punjab province were the population
of the study. A sample of 488 students from 20 schools of Punjab province in Pakistan was taken
by using simple random sampling technique. Ninety-six students participated in
pilot testing and 392 students participated in final tryout of test.
Instrument of the study
This
study comprised a multiple-choice type test of Geometry and this test was used
as instrument for data collection in the study. The steps in the development of
the test were as follow:
1.
Text book of
Mathematics for secondary level 9th published by Punjab Text Book
Board Lahore was consulted. All nine chapters (9 to 17, PP.168 to 267) of
geometry part of mathematics were defined as the universe of the test.
2.
A table of
specification was prepared. It was delimited to first three levels of Bloom’s
taxonomy of cognitive domains.
Table 1. Table of Specifications of
Items
|
Chapter No. |
Knowledge (Item no) |
Comprehension(Item no) |
Application (Item no) |
Total |
|
9 |
33 |
2, 34 |
3, 4 |
05 |
|
10 |
5 |
13, 32 |
35, 47 |
05 |
|
11 |
9, 29 |
12, 30 |
8, 21, 25 |
07 |
|
12 |
36, 46 |
41 |
10, 14 |
05 |
|
13 |
6, 37. 39 |
11, 23, 26 |
7, 38 |
08 |
|
14 |
22, 48 |
Nil |
40 |
03 |
|
15 |
1, 16 |
15 |
27, 42 |
05 |
|
16 |
17, 20, 28 |
18 |
19, 31 |
06 |
|
17 |
24 |
43 |
44, 45 |
04 |
|
Total |
17 |
13 |
18 |
48 |
|
|
|
|
|
|
3.
Following the
rules of development of multiple-choice items, 48 items with four options were
prepared.
4.
To examine the
content validity of the test items three subject experts were approached. They were teaching
this subject from at least 10 years and had M. Sc mathematics with M. Ed level
qualification. To analyze the face validity of test, a team of two experts
having Ph. D degree in educational assessment were chosen. Researchers sorted
out poor items following the evaluation of experts and improved them according
to suggestions of experts.
5.
Forty-eight
multiple-choice type test items with four options were arranged in a test
booklet form and required number of copies were prepared. Researchers
administered test booklets in examination conditions. The students were given
open time to solve the test. Average time taken by students was 90 minutes in
both trials.
6.
Scoring of answer books was done by the
researchers. Each correct response was given one mark. Zero mark was fixed for
wrong answers.
7. Item
analysis criteria was decided (see table 2) and each item of the test was
analyzed on the basis of data. None of the rejected items of pilot test was
included in final test. All revisions of items were incorporated keeping in
view their defects pointed out in item analysis, and improved items were again
included in the final test.
Table 2. Item Analysis Criteria of the Test
|
Item’s Interpretation |
Item Analysis Criteria |
||
|
Difficulty Power |
Discrimination Power |
Distractor Effect |
|
|
Selected item |
0.20-0.80 |
0.30 and above |
At least 2% response on each option |
|
Needs Revision |
0.20 – 0.80 |
0.20 – 0.29 |
Any distractor had less than 2% response |
|
Rejected item |
Below 0.20 |
Below than 0.20 |
Below than 2% response on option |
Results and Discussion
Item Analysis of the Test
Item analysis was done in two steps; item analysis of pilot testing data and item analysis of final try-out testing data. For understanding and comparison, results of pilot and final tryout are detailed in table 3.
Table 3. Item Analysis Results of Pilot and Final Try out Data
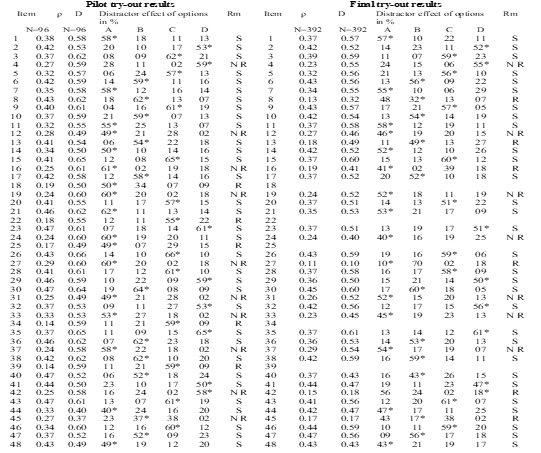
Note= * = Right options/ Key, ? = Discrimination level, D = Difficulty level, Rm = Remarks, S = Selected item, R = Rejected item
Regarding the Pilot Testing
The table 3 demonstrates that 33 items were selected, 10 items needed revisions while 5 items were rejected. It showed that item numbers 18, 22, 25, 34 and 39 did not match the criteria of selection of items because their discrimination level was less than 0.20. So, these were rejected. On the other hand, the item numbers 4, 12, 16, 19, 24, 27, 31, 37, 42 and 45 had discrimination level between 0.20 to 0.29. So, these items were considered for revision. While other items match the criteria of selected items.
Regarding the Final Try out Results
The
item numbers 18, 22, 25, 34 and 39 were rejected in pilot test. So, these
serials numbers were left blank in the table of final try-out test. Similarly,
the item numbers 4, 12, 16, 19, 27, 31, 33, 37, 42 and 45 were revised before
final try-out test.
The part of final try out results in
table 3 demonstrates that 30 items were selected, 7 items required revisions
and 6 items were rejected. It showed that item numbers 8, 13, 16, 27, 42 and 45
did not match the criteria of selection of items. So, these items were
rejected. On other hand, the item number 4, 12, 19, 24, 31, 33 and 37 had
discrimination level greater than 0.20 but less than 0.30. Therefore, these
items were needing revision for next try out. While other items matched the
criteria of selection of items, so these were selected for future use.
Difficulty Index of the Final try out Items
Difficulty
level of test play role in evaluation of quality of test. Analysis of
difficulty level of the test (see table 4) exhibited that majority of items of
the test were in middle difficulty range. A small number of test items (7%)
were out of the range of decided criterion of difficulty range. These items
were difficult for the respondents.
By comparing the quality of test with
criterion of Kelly (2014), 93% of items in the test were in acceptable range
and none of the item in test was easy item (0.71 to 1.00) because 93% items in
the test were in the range of middle difficulty level i.e. 0.31 to 0.70 ((see
table 4) and none of he items was very easy for the respondents.
Table
4.
Distribution of Item Difficulty Index of final try out items
|
Difficulty Range |
f |
% |
|
0.10 to 0.19 |
3 |
07 |
|
0.20 to 0. 29 |
0 |
00 |
|
0.30 to 0.39 |
1 |
02 |
|
0.40 to 0.49 |
9 |
21 |
|
0.50 to 0.59 |
27 |
63 |
|
0.60 to 0.61 |
3 |
07 |
|
Total |
43 |
100 |
Discrimination Index of the Final try Out
Items
Discrimination index
of the items tried out in final exhibited that 70% of the items were meeting
criterion of selected items. Moreover, all items were positively discriminating
high achievers from low achievers (see table 5).
By
comparing the results of this test regarding discrimination power of items with
the criterion given by Roid (2012) about definition of quality of test items,
this test has less (14%) number of poor items and some (16%) marginal items in
discriminating high achievers to low achievers but majority of reasonably good
or good items. He has elaborated that good items have a discrimination index of
0.40 and higher; reasonably good items from 0.30 to 0.39; marginal items from
0.20 to 0.29, and poor items less than 0.20.
Table 5. Distribution of Discrimination Power of
Final try out Items
|
Discrimination
Range |
f |
% |
|
0.11 to 0.19 |
6 |
14 |
|
0.20 to 0.29 |
7 |
16 |
|
0.30 to 0.39 |
15 |
35 |
|
4.41 to 0.47 |
15 |
35 |
|
Total = 0.11 to 0.47 |
43 |
100 |
Reliability
of the Test
Table 6. Summary of Reliability and Standard error
of Measurement of Pilot and Final try out Results
|
Test Trial Stage |
Sample |
n |
Variance |
? pq |
SD |
RT |
SE |
|
Pilot try out |
96 |
48 |
145.62 |
11.611 |
12.06 |
0.93 |
3.19 |
|
Final try out |
392 |
43 |
26.107 |
10.1951 |
5.11 |
0.62 |
3.15 |
Note:
n= number of items in the test, RT= reliability of test applying formula
KR 20, SE= standard error of measurement
Table 6 describes that reliability (using Kuder Richardson
20) of pilot try out data is good enough because acceptable reliability
estimates ranging is considered from 0.856 to 0.958 (Wilson, 2005) and
reliability in range of 0.832 to 0.931is acceptable for the student, class and
school environment scale in criterion defined by Popham (2005).
But,
analysis of reliability of final try out data shows although acceptable but low
(r= 0.62) in comparison to pilot try out data of the test. Analysis of
literature regarding the reliability of tests indicates that value of
correlation of teacher made test approximately 0.50 is accepted but nearly 0.60
is accepted and appreciated. According to Mohamad, et al (2015, p.165),
although value of reliability close to most upper range (1.00) is good but in
social sciences, value of correlation 0.60 is acceptable. But criterion
described by Bahoo (2015) and Raza (2012) explains that a test having
reliability in the range of 0.60 and 0.70 describes reliability of a test
slightly low and needs to be supplemented by more trials. But, In the present study, standard error of measurement of pilot as well as
final try out of data; 3.19 and 3.15 signifies a small piece of error in terms
of raw scores in results that is evidence of better reliability of results.
Descriptive Analysis of
Final Try-Out Test Score of the Examinees
Table
7.Statistical Analysis of
Test Scores of final try out of Data
|
Try out |
Total items |
n |
Range |
Minimum score |
Maximum score |
Mean |
Median |
Mode |
Skewness |
Kurtosis |
|
Pilot
try out |
48 |
096 |
40 |
06 |
46 |
27.29 |
30 |
15 |
-0.143 |
-1.34 |
|
Final
try out |
43 |
392 |
28 |
13 |
41 |
27.497 |
28 |
27 |
-0.193 |
-.126 |
Table 7 shows value
of range of data in final try out was less than of pilot try out.
Analysis of scores of mean, median and mode explores that the test was
difficult for the respondents and figure 1 and 2 exhibits that spread of scores
of students was not exactly on normal distribution but near to normal in final
distribution.
Figure 1
Spread of Scores of Pilot try out Data
Figure 2
Spread of Scores of Final try out Data
Gender and Locality Related Comparison of Scores of Students
Table 8. Gender and Locality wise Analysis
of Final try out Data
|
Gender wise Analysis |
Locality wise Analysis |
||||||||
|
T- Test for Equality of Means |
T- Test for Equality of Means |
||||||||
|
Item |
t |
Sig |
Mean Difference |
SED |
Item |
t |
Sig |
Mean Difference |
SED |
|
1 |
-.201 |
.830 |
-.010 |
.049 |
1 |
-.835 |
.404 |
-.041 |
.049 |
|
2 |
.499 |
.618 |
.025 |
.050 |
2 |
-.195 |
.845 |
.010 |
.050 |
|
3 |
-.222 |
.825 |
-.011 |
.051 |
3 |
-.432 |
.666 |
-.022 |
.052 |
|
4 |
.490 |
.619 |
-.024 |
.049 |
4 |
1.466 |
.143 |
.072 |
.049 |
|
5 |
.094 |
.925 |
.005 |
. 050 |
5 |
.648 |
.517 |
.033 |
.050 |
|
6 |
.425 |
.671 |
.022 |
. 051 |
6 |
.769 |
.442 |
.039 |
.051 |
|
7 |
-.161 |
.871 |
-.008 |
. 051 |
7 |
.567 |
.571 |
.029 |
.051 |
|
8 |
-.272 |
.786 |
-.014 |
. 051 |
8 |
.349 |
.727 |
.018 |
.052 |
|
9 |
.985 |
.325 |
.050 |
. 050 |
9 |
.445 |
.657 |
.023 |
.051 |
|
10 |
-1.33 |
.171 |
.071 |
. 051 |
10 |
.228 |
.820 |
.012 |
.052 |
|
11 |
-.676 |
.499 |
-.034 |
. 051 |
11 |
-.558 |
.577 |
.029 |
.051 |
|
12 |
-.534 |
.549 |
-.027 |
. 051 |
12 |
.436 |
.663 |
.022 |
.051 |
|
13 |
.168 |
.876 |
.009 |
. 051 |
13 |
-.101 |
.919 |
.005 |
.051 |
|
14 |
.081 |
.936 |
.004 |
. 051 |
14 |
-1.05 |
.200 |
.050 |
.051 |
|
15 |
-.761 |
.447 |
-.037 |
. 051 |
15 |
.180 |
.850 |
.010 |
.051 |
|
16 |
-1.03 |
.303 |
-.053 |
. 048 |
16 |
-.060 |
.952 |
-.003 |
.051 |
|
17 |
-.318 |
.750 |
-.016 |
. 050 |
17 |
-1.22 |
.203 |
-.065 |
.051 |
|
18 |
1.184 |
.237 |
-.060 |
. 051 |
18 |
-1.33 |
.165 |
-.071 |
.051 |
|
19 |
-.367 |
.712 |
.019 |
. 051 |
19 |
-1.98 |
.051 |
-.099 |
.051 |
|
20 |
-.024 |
.981 |
-.001 |
. 050 |
20 |
-1.19 |
.234 |
-.060 |
.051 |
|
21 |
.597 |
.551 |
-.031 |
. 051 |
21 |
-1.34 |
.178 |
-.069 |
.051 |
|
22 |
.324 |
.746 |
.016 |
. 050 |
22 |
-1.02 |
.285 |
-.054 |
.050 |
|
23 |
.115 |
.909 |
.006 |
. 050 |
23 |
-1.28 |
.201 |
-.065 |
.050 |
|
24 |
-.040 |
.968 |
.002 |
. 051 |
24 |
-1.18 |
.236 |
-.060 |
.051 |
|
25 |
-.283 |
.771 |
-.014 |
. 051 |
25 |
-.811 |
.418 |
-.041 |
.051 |
|
26 |
.340 |
.733 |
.017 |
. 051 |
26 |
.860 |
.390 |
.044 |
.051 |
|
27 |
.028 |
.978 |
.001 |
. 050 |
27 |
.740 |
.460 |
.037 |
.051 |
|
28 |
1.205 |
.229 |
.061 |
. 051 |
28 |
.363 |
.784 |
.014 |
.051 |
|
29 |
-1.18 |
.239 |
-.059 |
. 050 |
29 |
.360 |
.717 |
.018 |
.050 |
|
30 |
-.197 |
.844 |
-.010 |
. 051 |
30 |
.945 |
.345 |
.041 |
.051 |
|
31 |
.187 |
.856 |
-.009 |
. 050 |
31 |
.740 |
.460 |
.037 |
.051 |
|
32 |
.202 |
.840 |
.010 |
. 051 |
32 |
.315 |
.753 |
.016 |
.051 |
|
33 |
.843 |
.400 |
.043 |
. 050 |
33 |
-1.56 |
.118 |
-.079 |
.051 |
|
34 |
.306 |
.760 |
.009 |
. 050 |
34 |
.611 |
.542 |
.031 |
.051 |
|
35 |
.080 |
.937 |
.004 |
. 050 |
35 |
.152 |
.879 |
.008 |
.050 |
|
36 |
.997 |
.319 |
.050 |
. 051 |
36 |
-.142 |
.887 |
-.007 |
.051 |
|
37 |
.322 |
.747 |
.016 |
. 051 |
37 |
.024 |
.981 |
.001 |
.051 |
|
38 |
-.531 |
.599 |
-.029 |
. 050 |
38 |
-.436 |
.661 |
-.022 |
.051 |
|
39 |
.099 |
.921 |
.005 |
. 051 |
39 |
-.184 |
.854 |
-.009 |
.051 |
|
40 |
-1.16 |
.245 |
-.059 |
. 051 |
40 |
.816 |
.412 |
.042 |
.051 |
|
41 |
1.184 |
.237 |
.060 |
. 051 |
41 |
-.142 |
.887 |
-.007 |
.051 |
|
42 |
-.821 |
.412 |
-.041 |
. 051 |
42 |
-.310 |
.757 |
-.016 |
.051 |
|
43 |
-.549 |
.584 |
-.028 |
. 051 |
43 |
1.208 |
.228 |
.061 |
.050 |
|
44 |
.597 |
.537 |
.030 |
. 050 |
44 |
.521 |
.603 |
.027 |
.051 |
|
45 |
-.785 |
.433 |
-.039 |
. 051 |
45 |
-.953 |
.341 |
-.048 |
.050 |
|
46 |
-.747 |
.455 |
-.031 |
. 050 |
46 |
.154 |
.878 |
.008 |
.050 |
|
47 |
.943 |
.346 |
-.048 |
. 051 |
47 |
-.808 |
.419 |
-.041 |
.051 |
|
48 |
-.442 |
.658 |
-.023 |
. 051 |
48 |
.390 |
.698 |
.020 |
.052 |
|
Total |
-.098 |
.922 |
-.052 |
.524 |
Total |
.744 |
.457 |
.392 |
.526 |
Note: Sig ? 0.05, n=392, SED=
Standard Error of Difference
The
table 8 revealed that the values of mean difference between boys and girls and
rural and urban are nearly same
regarding all items. Moreover, t test results indicate no significant mean
difference between the test scores of groups.
Table
9. Comparison
of Mean Scores of Students in Final Test Based on Gender and Locality
|
Locality |
n |
Mean |
Gender |
n |
Mean |
|
Urban |
235 |
27.340 |
Male |
229 |
27.476 |
|
Rural |
157 |
27.732 |
Female |
163 |
27.527 |
|
Total |
392 |
27.497 |
Total |
392 |
27.497 |
Table 9 describes
comparison of mean difference of scores of rural versus urban and boys versus
girls in whole test. It explains no big difference between performance of
groups. This also explores that test was equally favorable for students on the
bases of gender and locality.
Conclusion
It was found that all items were in the range of middle difficult in the final test. Discrimination level of 5 items in pilot study and 6 items in final try-out was less than the criteria of the selection of items, so these eleven items were rejected. Thirty items of the test met the criteria of the selection of items. It was found that the mean score of final test was 27.497, its median was 28, the mode was 27, while the standard deviation of test was 5.11. It was found that the value of standard error of measurement was low and it indicated that the test has very low chance of error in results. The reliability of test was 0.93 for pilot try out but 0.62 for final try out data, that showed that test was reliable but needs more experimentation of testing on the samples. It was concluded that all test items had positive discrimination level. It was also concluded that the scores of students in final test were although not exactly but near to normal distribution.
Recommendations
The study recommended that 30 selected items became the basis for standardization of an achievement test of geometrical part of secondary level mathematics. These items may be used in further researches on other samples. The board of secondary examinations may select these items for the board examinations.
References
- Akhtar, H. (2015). Development of a semi standardized test of Economics for Class X1. M. Un Published M. Phil Thesis. Bahawalpur: The Islamia University of Bahawalpur
- Akhter, N. & Bahoo, R. (2015). Development of a Semi standardized Test of Education for Intermediate level. Journal of Educational Research, 18(2), 5 to 19.
- Clements, D.H., & Sarama, J. (2007). Effects of a preschool mathematics curriculum: Summative research on the building blocks project. Journal for Research in Mathematics Education. 38, 136-163.
- Donald, S. (2013). The Unthinkable: Standardized testing and the Future of American Education (5th ed.). Columbus: Columbus Metropolitan Club
- Gowdhaman, K. & Nachimuthu K. (2013). Item Analysis of History Achievement Test on Difference Index (DI) in the Criterion Referenced Measurement. India: Department of Education, Periyar University.
- Hulin, C. L., Drasgow, F. & Parsons, C. K. (2013) Item response theory (5th Ed). Homewood, IL: Dow-Jones Irwin
- Kelly, M. (2014). The Purposes of Tests. Retrieved 3 December, 2014, Available on
Cite this article
-
APA : Akhter, N., Usmani, A. A., & Iqbal, S. (2019). Development and Validation of Multiple-Choice Test of the Geometry Part of Mathematics for Secondary Class. Global Social Sciences Review, IV(II), 203-210. https://doi.org/10.31703/gssr.2019(IV-II).27
-
CHICAGO : Akhter, Nasreen, Ahmad Akhtar Usmani, and Sabiha Iqbal. 2019. "Development and Validation of Multiple-Choice Test of the Geometry Part of Mathematics for Secondary Class." Global Social Sciences Review, IV (II): 203-210 doi: 10.31703/gssr.2019(IV-II).27
-
HARVARD : AKHTER, N., USMANI, A. A. & IQBAL, S. 2019. Development and Validation of Multiple-Choice Test of the Geometry Part of Mathematics for Secondary Class. Global Social Sciences Review, IV, 203-210.
-
MHRA : Akhter, Nasreen, Ahmad Akhtar Usmani, and Sabiha Iqbal. 2019. "Development and Validation of Multiple-Choice Test of the Geometry Part of Mathematics for Secondary Class." Global Social Sciences Review, IV: 203-210
-
MLA : Akhter, Nasreen, Ahmad Akhtar Usmani, and Sabiha Iqbal. "Development and Validation of Multiple-Choice Test of the Geometry Part of Mathematics for Secondary Class." Global Social Sciences Review, IV.II (2019): 203-210 Print.
-
OXFORD : Akhter, Nasreen, Usmani, Ahmad Akhtar, and Iqbal, Sabiha (2019), "Development and Validation of Multiple-Choice Test of the Geometry Part of Mathematics for Secondary Class", Global Social Sciences Review, IV (II), 203-210
-
TURABIAN : Akhter, Nasreen, Ahmad Akhtar Usmani, and Sabiha Iqbal. "Development and Validation of Multiple-Choice Test of the Geometry Part of Mathematics for Secondary Class." Global Social Sciences Review IV, no. II (2019): 203-210. https://doi.org/10.31703/gssr.2019(IV-II).27