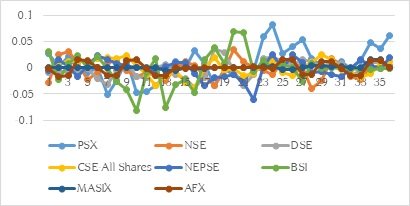
Table 11 shows the results of Change in CAAR's (Cumulative Average abnormal Returns) after the third wave of Corona in South Asian countries in the event window of 35 days. AS per findings, PSX (Pakistan Stock Exchange), NSE (National Stock Exchange), CSE All Shares (Sri Lanka Stock Exchange), and AFX (Afghanistan Stock Exchange) shows consistent negative cumulative abnormal returns while the rest of the stock market indices remain unaffected, and it did not result in negative cumulative abnormal returns for the investors as shown in fig 6.
Table 11. Cumulative Average Abnormal returns (CAAR's) Change in South Asian stock from day 0 to 35 after the second wave of Corona
Event Window
PSX
NSE
DSE
CSE-All Shares
NEPSE
BSI
MATRIX
AFX
0
0.026824
-0.02844
-0.00898
0.000411
-0.00545
0.03064
0.000812
-0.00097
1
0.001463
0.025252
-0.0058
0.009772
0.015394
-0.0235
2.28E-05
-0.01607
2
0.021494
0.030858
-0.00982
0.012249
0.001259
0.00755
2.28E-05
-0.01533
3
-0.00088
0.009208
-0.00834
0.010699
-0.01699
0.02313
2.28E-05
0.014648
4
-0.00963
-0.02197
-0.00245
0.01125
0.004053
-0.0007
2.28E-05
0.01423
5
0.000257
-0.00977
-0.01997
0.016447
0.022875
0.02137
2.28E-05
-0.0007
6
-0.05092
0.009289
-0.03273
0.018482
0.015074
-0.0016
2.28E-05
-0.01516
7
-0.02418
0.01312
-0.0061
0.017831
0.008172
-0.0271
2.28E-05
-0.01567
8
0.014727
-0.00589
0.009881
0.022898
0.003835
-0.0418
2.28E-05
0.014298
9
-0.04739
-0.01769
-0.0175
0.003715
-1.2E-05
-0.0808
2.28E-05
0.014541
10
-0.04601
-0.00939
-0.01832
-0.01387
-0.00149
-0.01
2.28E-05
-0.00099
11
-0.03399
-0.01535
0.00055
-0.0347
-0.00622
0.01708
-2.2E-06
-0.01492
12
-0.01588
-0.02523
0.006823
-0.01775
0.00145
-0.0759
-0.00478
-0.01447
13
0.012109
0.000278
-0.01391
-0.00533
0.009013
-0.0323
-0.00477
-0.0006
14
-0.00056
0.010888
-0.02074
-0.02896
0.010048
-0.0225
-3.3E-06
-0.00098
15
0.031607
0.003446
-0.03788
-0.0378
-0.01186
-0.0467
-0.00132
-0.00033
16
0.007804
-0.01409
-0.01895
-0.00043
-0.03351
0.01614
-0.00132
0.000294
17
-0.03367
-0.03491
0.036112
0.019564
-0.01928
0.03767
3.32E-06
0.000161
18
-0.00294
-0.00413
0.029248
-0.00589
-0.01744
0.0079
2.01E-05
-0.00033
19
-0.01233
0.034454
-0.00634
-0.00163
-0.01231
0.06796
3.7E-05
0.0007
20
-0.02223
0.011217
-0.03416
-0.01499
-0.02907
0.06688
6.02E-05
0.000165
21
-0.00484
6.08E-05
-0.01393
-0.01111
-0.06073
-0.0083
8.35E-05
0.001895
22
0.059508
-0.00515
0.01686
0.009349
0.004896
0.01358
0.002923
0.000595
23
0.081525
-0.01396
0.022046
0.011939
0.025445
-0.0003
0.002916
-0.00176
24
0.026613
0.01094
0.0125
-0.00877
-0.001
0.00672
-0.00394
0.015168
25
0.03986
0.011514
0.006092
-0.01518
0.02475
0.00016
-0.00393
0.014654
26
0.052668
-0.00034
0.015392
0.002179
0.010023
-0.0267
9.26E-05
-0.01225
27
0.017977
-0.04003
0.012061
0.010314
-0.00986
0.00744
0.004104
-0.01223
28
0.003844
-0.0238
0.000779
0.024392
-0.00714
-0.0011
0.004092
0.011818
29
0.000276
0.017559
0.012135
0.015709
-0.01252
-2E-05
0.002496
0.011467
30
0.011759
0.006541
0.007741
-0.003
-0.01757
-0.002
0.002487
-0.00095
31
-0.00246
-0.01662
-0.01541
-0.0098
-0.00242
-0.0022
5.37E-05
-0.01443
32
0.012705
-0.02349
-0.00573
-0.01823
0.015017
-0.0035
5.37E-05
-0.01419
33
0.047635
0.002031
0.009434
-0.01028
0.004937
-0.004
0.016236
0.014099
34
0.036256
0.001935
0.009041
0.006227
-0.00154
-0.0008
0.016195
0.014163
35
0.060646
0.004269
0.004629
0.012552
0.018273
-0.0019
-2.8E-05
-0.00067
Abstract
The crisis of COVID-19 comes with a calamitous economic stance. The South Asian countries experience their nastiest economic performance in the last four decenniums, and a moiety of the countries are falling into recession. This paper checks the impact of the first, second and third waves of COVID-19 outbreak on the stock market indices of all the South Asian countries, including India, Pakistan, Afghanistan, Sri Lanka, Bangladesh, Maldives, Nepal, and Bhutan. The study has utilized the Event Study Methodology and results exhibit that COVID-19 decreases the mean returns of all the stock market indices and increases their volatility, which designates that Corona does influence all the stock markets of South Asia in decrementing their returns and incrementing volatility. Overall, the negative effect of the first wave of COVID-19 is not paramount across all the indices except the National Stock Exchange of India (NSE), albeit its second wave did not affect any of the stock market indices significantly. In contrast, the third wave affects the stock markets indices of Pakistan (PSX) and Afghanistan (AFX).
Key Words
Stock Asian Countries, COVID-19, Abnormal Returns, Event Study
Introduction
According to WHO (World Health Organization), the first case of COVID-19 was identified on 31 December 2019 in Wuhan, the city of China. At that, time people of China were moving towards their hometowns to celebrate the Chinese Incipient Year, which became the leading cause of the spread of this disease and turned that outbreak into a national crisis. This pandemic hit the whole economy ecumenical without anyone kenning and resulted in the factories shut down and unemployment all around the world, leaving policymakers, businesspersons, Regimes, managers, scientists, denizens, and medicos kindred in dismay. As this virus represents a Pandora’s Box, the consummate 45-days lock-down in industrial countries took everybody off-sentinel.
Due to the quarantine in most of the industrialized countries from March to the cessation of the year 2020 and its second wave, many Philomaths and economists presage a deep recession for 2020-21. The developing countries of South Asia will have their worst financial performance of the last four decenniums. The chances of people being infected with this virus are more protuberant in these developing countries because gregarious distancing is arduous to maintain, and they have inhibited access to health care and even soap in the rural areas. Moreover, there are chances that people will get unemployed and face the nastiest inflation in the prices of rudimental commodities.
As per Efficient Market Hypothesis, any particular event should result in the vicissitude of the stock prices because investors' inefficient markets are planarity vigilant and well apprised, and it shows the effect of this information disclosure. Then, the Arbitrage pricing theory (APT) is the asset-pricing model. Its main concept is that returns of assets can be presaged by utilizing the linear relationship between the expected returns of the assets and the macroeconomic variables like a chronic disease which captures the systematic risk and plenary undiversifiable. Under these circumstances, rational investors make decisions, which are the antithesis to what is prognosticated by the standard models of finance. COVID-19 is bringing major challenges for the developing countries of South Asia because people are losing their jobs because of the lock-down situation in the country. People are panicking because of the incremented death rates and the wildest spread of this disease across the globe.
All these unexpected and external issues can bring the stock market down, and they hold the capacity to transmute the sentiments of rational investors. Investment decisions are affected by the solicitousness and deplorable mood of the investors, and such investors get more pessimistic about the future and take less risk consequently (Kaplanski & Levy, 2010). Consequently, these negative feelings and sentiments affect investment decisions and returns of any stock market. The pandemic situation engendered by the first and second waves of COVID-19 captures the opportunity to check the impact of this disease on the stock market of affected nations of South Asian countries.
This paper checks the impact of the first and second waves of COVID-19 on the developing stock markets of South Asia, which includes India, Pakistan, Afghanistan, Sri Lanka, Bangladesh, Maldives, Nepal, and Bhutan. Because of the short period of this outbreak, an event study is utilized to check the presence of aberrant returns after the occurrence of this outbreak in the countries of South Asia. The study reports the occurrences of the first and second waves of COVID-19 in the South Asian countries and checks its effect on the stock markets by visually examining the presence of eccentric returns. This paper denudes affluence of insight into the outbreak of COVID-19 in South Asia.
The world's infection peak has visually examined on 3 March 2020 as presaged by the infectious model. The decision tree previses that Corona Virus is irrigating the stock market around the globe that has commenced from Western Europe. Literature is available for the developed countries, but due to the circumscribed availability of data, no insight is available for the developing countries of South Asia altogether. The goal of this study is to optically discern the replication of investors and stock markets after the advent of the first and second waves of Corona. The novelty is in shepherding the empirical research by retrieving the scientific data and conducting the experiments from the standpoints of business and science. Its main contribution in the literature of finance is by providing the facts on how the stock markets respond to the first and second wave of Corona and how it gets stable after that outbreak.
This study aims to visually perceive the impact of the first, second, and third waves of COVID-19 on the stock market performance of South Asian countries by calculating the anomalous returns. The study will withal optically discern the consequentiality of market replication by calculating the accumulated eccentric returns.
Literature Review
The impact of COVID-19 on the stock markets is one of the sultry topics in finance nowadays. Akhtaruzzaman et al. (2021) have checked how financial contagion appears between the financial and non-financial firms of G7 countries and China after this outbreak. Ashraf (2020) studies that stock market returns are declined as the number of corroborated cases has incremented. Cheema et al. (2020) have revealed that investors have lost their confidence in gold during this period of this outbreak. Chevallier (2020) has examined the impact of COVID-19 on financial markets by utilizing GARCH, VAR Models, and Susceptible infective abstracted and found consequential results as well. Ahmed has (2020) studied the Pakistani stock market and its replication of it. He finds that recuperations of COVID-19 are affecting the stock market performance significantly. COVID-19 not only affects the developed or developing nation's stock markets but additionally does affect the minute and medium enterprises of the countries and their future development in a consequential way (Berchin et al., 2020; Murphy et al., 2020).
Kumar et al. (2020) have investigated the impact of this virus on the engendered and operations management of the companies and find that this disease put all the managers in a panic situation and caused them to make erroneous decisions under these circumstances. Burdekin and Harrison have (2021) checked the impact of the onset of COVID-19 on the stock market performance for the 80 well-kenned stock markets and found that Corona Virus does worsen the stock market performance but the impact of ascending deaths is not consistent along with all the countries. Cox et al. (2020) have found that the stock market performance of all the countries is dependent more on the sentiments of the investors in lieu of the fundamentals. Just and Echaust (2020) have examined the incremented volatility of stock markets in tardy February 2020 find kindred results.
Both Ashraf (2020) and Alber (2020) have highlighted that stock market performance is affected more by the incrementing cases of Coronavirus than the death rates. Awadhi et al. (2020) have revealed the consequential impact of both the variables on the stock markets of China from 10 January to 16 March 2020. Adeel-Farooq et al. (2017) have identified that trade liberalization has had a positive impact on the economy of Pakistan. Sahasranamam (2021) has investigated the response of the state of India towards the pandemic of COVID-19. Earlier to it, Khan et al. (2020) have observed the paramount impact of COVID-19 cases on the stock market performance of sixteen countries by utilizing the Panel data analysis.
The first wave of COVID-19 has played a key role in affecting the stock markets of all the countries, but surprisingly, its second and third waves did not affect the stock markets significantly. Phan and Naryan (2020) have concluded that initial over-reaction of investors was thereafter the first wave of Corona, and it is conspicuous from the data until April 2020, but they further find that initial negative reaction to the incipient cases and death rate of Corona patients is followed by a positive replication. Virtually a moiety of the stock markets commenced exhibiting positive returns when the cases of Corona reached 100,000, and its death rate reaches 100. This paper is an endeavor to find the impact of the first, second, and third waves of Corona on the stock market's performance of South Asian countries. The prior work on Corona was inhibited to the first quarter of 2020; this study endeavors to consummate this gap by extracting the data from 2020 to May 2021. This would show how the investors and stock markets respond to a different wave of COVID-19.
Event Study Methodology
This paper utilizes the Event study method for checking the impact of the first and second waves of COVID-19 on the stock market performance of South Asian countries. Ball & Brown (1968) are considered among pioneers to use Event Study Methodology in Accounting and Finance disciplines. As per the event study method, when the efficient market hypothesis is valid, then any particular event should result in the transmutation of the stock prices because investors inefficient markets are plenarily cognizant and well apprised, and it shows the effect of this information disclosure. The event study methodology is widely utilized in empirical studies of finance and economics.
Agrawal & Kamakura (1995) find the impact of celebrity endorsement in explicating aberrant stock returns. Liu et al. (2020) check the impact of COVID-19 on the stock markets of 21 leading stock markets of the world. Predicated on the subsisting literature of finance, an Event study is utilized for checking the average eccentric returns (AAR's) and cumulative average aberrant returns (CAAR's) of the stock indices of South Asian countries after the outbreak of the first, second, and third waves of COVID-19.
Data and its Sources
The study uses the daily closing prices of all the stock markets of South Asian countries. The data has been collected from 1 January 2020 to the date. The daily data have been collected from the official websites of Yahoo Finance (www.yahoo.fiannce.com) and Investing (www.investing.com). Additionally, the following stock markets and their related stock markets have been used for collecting the data. The indices of all the stock markets are shown in table 1 given below.
Table 1. Indices of the South Asian Countries
Definition | Abbreviation | Country |
Pakistan Stock Exchange | PSX | Pakistan |
National Stock Exchange | NSE | India |
Dhaka Stock Exchange | DSE | Bangladesh |
Sri Lanka Stock Exchange | CSE-All Shares | Sri Lanka |
Nepal Stock Exchange | NEPSE | Nepal |
Royal Securities Exchange of Bhutan | BSI | Bhutan |
Maldives Stock Index | MATRIX | Maldives |
Afghanistan Stock Exchange | AFX | Afghanistan |
Set-up of Event Study
This study checks the impact of the first and second wave of COVID-19 on the stock market performance of South Asian countries, which includes India, Pakistan, Afghanistan, Sri Lanka, Bangladesh, Maldives, Nepal, and Bhutan. This virus was first identified to the WHO on 31 December 2020 in the Wuhan city of China. The Expert of the National Health and Fitness Commission of China, Zhong Nanshan, declared in an interview that this virus is contagious and is transmitting to other people expeditiously. After that, this news prehended the attention of International Media.
First Wave of COVID-19
Zafar Mirza, the Prime Minister of Health attested to the two cases of Corona in Pakistan on 26 January 2020. The first patient was a student of Sindh, while the second one emanated from the federal Zone. Both have returned from Iran. On 30 January 2020, the officials of India attested this virus, and that reached its peak when some students and a group of tourists came back from Italy. The first case of COVID-19 has attested in a 35-year-old man from the province of Herat, Afghanistan, on 24 February. The country's Institute of Epistemology in Bangladesh corroborated the first three cases of Corona on March 2020, while it has substantiated by Bhutan on 6 March when a 76-year-old American Denizen peregrinated via India to the country. It reached the Maldives and Sri Lanka on 7 March, 27 January, respectively. Nepal was the first country in South Asia, which attested its first case on 23 January when a Student of Katmandu came back from Wuhan city of China.
Second Wave of COVID-19
There is no macrocosmic definition of the second or third wave of Corona. A surge in the number of infected patients and deaths after the initial decline in the number of patients is called an incipient wave of Corona. Pakistan has officially promulgated the Second Wave of COVID-19 after the sudden ascend in daily patients and death rate. The officials of India substantiated it on 21 November 2020 while it hit Afghanistan and Bhutan on 19 & 7 November, respectively, after an escalation in daily cases. The COVID-19 optically discerned its second wave in the Maldives, Sri Lanka, Bangladesh, and Nepal on 24 August, 11 November, 23 September, and 31 October correspondingly.
Third Wave of COVID-19
Results & Discussion
The mean returns and standard deviation of all the stock indices of South Asia are shown in table 2. It also shows the total number of trading days for each index. Results show that mean returns are positive for all the stock indices except the stock market of Bhutan and Maldives, which are showing negative returns from 2020 to 2021. The standard deviation is positive and increased for all the stock market indices. This shows that COVID-19 decreases the mean returns of all the stock market indices and increases their volatility, which means that Corona influences all the stock markets of South Asia by decreasing their returns and increasing volatility. The result of Mean Returns & Standard Deviation of the Sample Indices is shown in table 2 given below.
Table 2. Mean Returns & Standard Deviation of the Sample Indices
Index | Total no. of Trading days | Mean Returns of Event groups | St. Deviation of Event Groups |
PSX | 402 | 0.000811 | 0.030709 |
NSE | 267 | 0.00059292 | 0.019548721 |
DSE | 230 | 0.001101254 | 0.014110499 |
CSE-All Shares | 227 | 0.001628575 | 0.013880652 |
NEPSE | 199 | 0.003697803 | 0.018908061 |
BSI | 271 | -0.00011515 | 0.037462528 |
MATRIX | 395 | -1.15311E-05 | 0.013395788 |
AFX | 283 | 0.000238045 | 0.006792816 |
Table 3 shows the AAR's results on the event day when the officials of the respective countries confirm the COVID-19 and one day after the Event. The results show that all the stock market indices' AARs get negative right after the first wave of Corona. Only the Afghanistan Stock market index shows positive returns, which means the first wave of Corona did not affect Afghanistan, and investors did not get panic and make rational decisions.
Table 3. Average Abnormal returns on the Event day and day after the Announcement of the First Wave of Corona
Index | Event Day | One day after the Event |
PSX | -0.008701346 | -0.016547057 |
NSE | -0.007096525 | -0.005314213 |
DSE | -0.022056685 | -0.066516339 |
CSE-All Shares | -0.00811782 | -0.006335118 |
NEPSE | -0.019947708 | -0.023271375 |
BSI | -0.003538096 | -0.077245605 |
MATRIX | -0.000545915 | -0.000545915 |
AFX | 0.010316713 | 0.003277494 |
Table 4 shows the AAR's results on the event day when the officials of the respective countries confirm the second wave of COVID-19 and one day after the Event. The results show that all the stock market indices' AARs remain positive except the stock market indices of DSE, MASIX & AFX. This shows that the second wave of Corona only hit the three countries of Bangladesh, Maldives, and Afghanistan while the other South Asian countries remain unaffected.
Table 4. Average Abnormal returns on the Event day and day after the Announcement of the second Wave of Corona
Index | Event Day | One day after the Event |
PSX | -0.019664181 | 0.003534569 |
NSE | 0.003229382 | 0.00056015 |
DSE | -0.003886661 | -0.003022491 |
CSE-All Shares | -0.004684246 | 0.000294572 |
NEPSE | 0.012274975 | 0.000149207 |
BSI | -0.005270992 | 0.00118261 |
MATRIX | -0.001178614 | -0.001178614 |
AFX | 0.001371885 | -0.00191523 |
Table 5 shows the AAR's results on the event day when the officials of the respective countries confirm the third wave of COVID-19 and one day after the Event. The results show that all the stock market indices' AARs remain positive except the stock market indices of BSI & AFX. This shows that the second wave of Corona only affects these two countries of Bhutan and Afghanistan while the other South Asian countries remain unaffected.
Table 5. Average Abnormal returns on the Event day and day after the Announcement of the third Wave of Corona
Index | Event Day | 1 day after the Event |
PSX | -0.006109 | 0.007572 |
NSE | 0.0152875 | 0.009965 |
DSE | -0.005862 | 6.47E-05 |
CSE-All Shares | 0.0002898 | 0.009483 |
NEPSE | 0.0025028 | 0.012891 |
BSI | -0.004375 | -0.01912 |
MATRIX | 1.141E-05 | 1.14E-05 |
AFX | -0.000802 | -0.01527 |
Table 6 shows the results of Change in AAR's (Average abnormal Returns) after the first wave of Corona in South Asian countries in the event window of 35 days. Results show that as the pandemic broke out in the countries, most of the AAR's became negative following the event day. The stock market of DSE shows a sharp decline right after the event day, as shown in fig 1, but it's getting stable after 15 days of the event while the rest of the market indices shows mixed results.
Table 6. AAR's Change from day 0 to 35 after the First Wave of Corona
Event Window | PSX | NSE | DSE | CSE-All Shares | NEPSE | BSI | MATRIX | AFX |
0 | -0.0087013 | -0.007097 | -0.02205668 | -0.00812 | -0.01995 | -0.00354 | -0.00055 | 0.010317 |
1 | -0.0165471 | -0.005314 | -0.06651634 | -0.00634 | -0.02327 | -0.07725 | -0.00055 | 0.003277 |
2 | -0.0242923 | -0.021343 | 0.038354175 | 0.010924 | 0.013466 | -0.03931 | -6.1E-05 | -0.0193 |
3 | -0.0210222 | 0.0244743 | 0.018821479 | -0.00037 | -0.00109 | 0.050034 | 0.004908 | 0.012139 |
4 | 0.09255833 | 0.0092994 | -0.02402898 | -4.8E-06 | -0.00492 | -0.00321 | -0.00064 | -0.00188 |
5 | 0.00039584 | 0.0045775 | -0.03916357 | 0.000909 | 0.009724 | -0.00324 | -0.00064 | 0.00739 |
6 | -0.0213747 | -0.002755 | -0.04962653 | 0.002453 | 0.010013 | -0.05114 | -0.00064 | 0.016265 |
7 | 0.03243535 | -0.004545 | -0.04332307 | 0.001361 | -0.00281 | 0.021485 | -0.00064 | -0.00851 |
8 | -0.039468 | 0.0077575 | 0.100911762 | -0.00105 | -0.01299 | 0.034416 | -0.00064 | 0.010809 |
9 | -0.0512371 | 0.0086896 | -0.0033952 | -0.00159 | 0.000185 | -0.01493 | -0.0061 | 0.004537 |
10 | 0.02236354 | -0.001517 | 0.006772702 | -0.0062 | -0.00943 | -0.00307 | -0.08543 | 0.013261 |
11 | -0.0233881 | -0.004277 | -0.00117505 | -0.00332 | -0.01151 | -0.07288 | 0.000599 | -0.01327 |
12 | -0.0510136 | -0.00512 | 0.010056007 | -0.00284 | 0.004422 | 0.046142 | 0.000599 | -0.00241 |
13 | 0.02188782 | -0.003895 | 0.00220802 | -0.00327 | 0.012477 | 0.017694 | 0.000599 | -0.00729 |
14 | -0.0961477 | 0.0115619 | 0.01499611 | -0.00061 | 0.002376 | 0.005763 | 0.000599 | -0.00599 |
15 | -0.020575 | -0.003486 | -0.01318039 | 0.004339 | -0.00267 | -0.06308 | 0.000599 | 0.004056 |
16 | -0.110009 | -0.020309 | -0.00487629 | 0.003536 | 0.01194 | 0.070257 | 0.000599 | -0.01459 |
17 | 0.05612601 | -0.001393 | 0.001304213 | -0.00189 | 0.020398 | -0.05646 | 0.000599 | -0.00458 |
18 | -6.834E-05 | -0.009034 | 0.000195202 | -0.00453 | -0.00356 | 0.049619 | 0.000702 | -0.02359 |
19 | -0.0910354 | -0.001884 | 0.004921682 | -0.0099 | -0.00088 | 0.01759 | 0.000702 | 0.001678 |
20 | -0.1075046 | -0.036011 | 0.001315975 | -0.0129 | 0.01576 | 0.004301 | 0.000844 | 0.00488 |
21 | 0.05004565 | -0.002722 | 0.004236931 | 0.007969 | 0.042071 | -0.02069 | 0.000844 | 0.010636 |
22 | 0.05402089 | 0.0178547 | 0.003781261 | -0.00986 | -0.00868 | 0.003731 | 0.000844 | 0.014921 |
23 | -0.0542625 | -0.001579 | 0.002916289 | 0.008145 | 0.021073 | 0.003597 | 0.071464 | 0.013152 |
24 | 0.08509711 | 0.0053802 | 0.001875115 | 0.004687 | 0.022783 | 0.014052 | -0.00024 | 0.011962 |
25 | -0.0229962 | -0.02121 | 0.001095641 | -0.01139 | 0.010791 | -0.0466 | -0.00024 | -0.01144 |
26 | 0.07698259 | -0.045135 | 0.003137904 | 0.004294 | -0.03879 | 0.026776 | -0.00022 | -0.00085 |
27 | 0.04840044 | 0.0080746 | 0.002546779 | -0.03132 | -0.07473 | 0.01576 | -0.00022 | -0.01325 |
28 | -0.067356 | -0.078961 | 0.001872704 | -0.03607 | 0.001473 | -0.03335 | -0.00023 | -0.00927 |
29 | 0.00228422 | 0.050032 | 0.0032461 | 0.025056 | -0.0543 | 0.026926 | -0.00025 | -0.00369 |
30 | 0.00846135 | -0.068581 | 0.002432603 | -0.02807 | -0.00838 | -0.00025 | -0.00025 | -0.00138 |
31 | 0.08042472 | -0.01087 | 0.003408279 | -0.01837 | -0.06642 | 0.006218 | -0.00025 | 0.011184 |
32 | 0.03654962 | -0.041633 | 0.004236668 | -0.05141 | 0.05395 | -0.0071 | -0.00025 | -0.00324 |
33 | -0.061045 | -0.006236 | 0.005132418 | -0.02302 | -0.03397 | -0.01557 | -0.00025 | 0.009978 |
34 | 0.02913413 | 0.0768757 | 0.00510328 | -0.01445 | -0.0466 | -0.01336 | -0.00025 | 0.000896 |
35 | 0.01059883 | -0.122033 | 0.005778312 | 0.047989 | 0.007081 | 0.028514 | -0.00025 | 0.003201 |
Figure 1
AAR after the First Wave of Covid-19
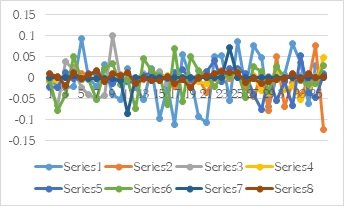
Table 7 shows the results of Change in CAAR's (Cumulative Average abnormal Returns) after the first wave of Corona in South Asian countries in the event window of 35 days. Results show that after the confirmation of this virus, almost all the CAAR's become significantly negative following the event day. The stock market of DSE shows a sharp decline right after the event day, as shown in fig 2, but it gets stable after 17 days of the event while the rest of the market indices show mixed results.
Table 7.CAAR's Change in South Asian stock from day 0 to 35 after first wave of Corona
Event Window | PSX | NSE | DSE | CSE-All Shares | NEPSE | BSI | MATRIX | AFX |
0 | -0.0087 | -0.00775 | -0.02206 | -0.00812 | -0.01995 | -0.00354 | -0.00055 | 0.01032 |
1 | -0.02525 | -0.01241 | -0.08857 | -0.01445 | -0.04322 | -0.08078 | -0.00109 | 0.01359 |
2 | -0.04084 | -0.02666 | -0.02816 | 0.004589 | -0.00981 | -0.11656 | -0.00061 | -0.016 |
3 | -0.04531 | 0.003131 | 0.057176 | 0.01055 | 0.012372 | 0.01072 | 0.004847 | -0.0072 |
4 | 0.071536 | 0.033774 | -0.00521 | -0.00038 | -0.00602 | 0.046825 | 0.004271 | 0.01026 |
5 | 0.092954 | 0.013877 | -0.06319 | 0.000904 | 0.0048 | -0.00645 | -0.00127 | 0.00551 |
6 | -0.02098 | 0.001822 | -0.08879 | 0.003362 | 0.019736 | -0.05438 | -0.00127 | 0.02365 |
7 | 0.011061 | -0.0073 | -0.09295 | 0.003815 | 0.007199 | -0.02965 | -0.00127 | 0.00775 |
8 | -0.00703 | 0.003213 | 0.057589 | 0.000308 | -0.0158 | 0.055901 | -0.00127 | 0.0023 |
9 | -0.09071 | 0.016447 | 0.097517 | -0.00265 | -0.0128 | 0.019483 | -0.00674 | 0.01535 |
10 | -0.02887 | 0.007173 | 0.003378 | -0.00779 | -0.00925 | -0.01801 | -0.09152 | 0.0178 |
11 | -0.00102 | -0.00579 | 0.005598 | -0.00951 | -0.02094 | -0.07595 | -0.08483 | -6E-06 |
12 | -0.0744 | -0.0094 | 0.008881 | -0.00616 | -0.00709 | -0.02674 | 0.001199 | -0.0157 |
13 | -0.02913 | -0.00902 | 0.012264 | -0.00611 | 0.016899 | 0.063836 | 0.001199 | -0.0097 |
14 | -0.07426 | 0.007667 | 0.017204 | -0.00388 | 0.014853 | 0.023457 | 0.001199 | -0.0133 |
15 | -0.11672 | 0.008076 | 0.001816 | 0.003731 | -0.00029 | -0.05732 | 0.001199 | -0.0019 |
16 | -0.13058 | -0.0238 | -0.01806 | 0.007875 | 0.009274 | 0.007178 | 0.001199 | -0.0105 |
17 | -0.05388 | -0.0217 | -0.00357 | 0.001643 | 0.032338 | 0.0138 | 0.001199 | -0.0192 |
18 | 0.056058 | -0.01043 | 0.001499 | -0.00642 | 0.016839 | -0.00684 | 0.001301 | -0.0282 |
19 | -0.0911 | -0.01092 | 0.005117 | -0.01443 | -0.00444 | 0.067209 | 0.001404 | -0.0219 |
20 | -0.19854 | -0.0379 | 0.006238 | -0.0228 | 0.014877 | 0.021891 | 0.001546 | 0.00656 |
21 | -0.05746 | -0.03873 | 0.005553 | -0.00493 | 0.057832 | -0.01639 | 0.001688 | 0.01552 |
22 | 0.104067 | 0.015132 | 0.008018 | -0.00189 | 0.033394 | -0.01696 | 0.001688 | 0.02556 |
23 | -0.00024 | 0.016276 | 0.006698 | -0.00172 | 0.012395 | 0.007328 | 0.072308 | 0.02807 |
24 | 0.030835 | 0.003801 | 0.004791 | 0.012831 | 0.043855 | 0.017649 | 0.071222 | 0.02511 |
25 | 0.062101 | -0.01583 | 0.002971 | -0.00671 | 0.033574 | -0.03254 | -0.00048 | 0.00052 |
26 | 0.053986 | -0.06635 | 0.004234 | -0.0071 | -0.028 | -0.01982 | -0.00046 | -0.0123 |
27 | 0.125383 | -0.03706 | 0.005685 | -0.02703 | -0.11352 | 0.042536 | -0.00044 | -0.0141 |
28 | -0.01896 | -0.07089 | 0.004419 | -0.06739 | -0.07325 | -0.01759 | -0.00045 | -0.0225 |
29 | -0.06507 | -0.02893 | 0.005119 | -0.01101 | -0.05283 | -0.00643 | -0.00048 | -0.013 |
30 | 0.010746 | -0.01855 | 0.005679 | -0.00301 | -0.06268 | 0.026679 | -0.0005 | -0.0051 |
31 | 0.088886 | -0.07945 | 0.005841 | -0.04643 | -0.0748 | 0.005972 | -0.0005 | 0.00981 |
32 | 0.116974 | -0.0525 | 0.007645 | -0.06977 | -0.01247 | -0.00088 | -0.0005 | 0.00795 |
33 | -0.0245 | -0.04787 | 0.009369 | -0.07443 | 0.019983 | -0.02266 | -0.0005 | 0.00674 |
34 | -0.03191 | 0.070639 | 0.010236 | -0.03747 | -0.08056 | -0.02893 | -0.0005 | 0.01087 |
35 | 0.039733 | -0.04516 | 0.010882 | 0.033543 | -0.03952 | 0.015151 | -0.0005 | 0.0041 |
Figure 2
CAAR after the Frist Wave of Covid-19
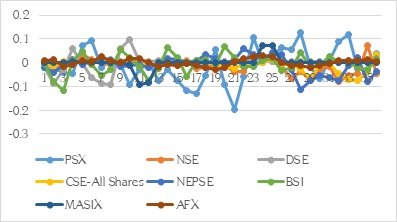
Table 8 shows the results of Change in AAR's (Average abnormal Returns) after the second wave of Corona in South Asian countries in the event window of 35 days. Results show that after the announcement of the Second wave by the country's official, only PSX (Pakistan Stock Exchange) showed consistent negative returns while the rest of the stock market indices remained unaffected, and it did not result in negative abnormal returns for the investors as shown in fig 3.
Table 8.Average Abnormal returns (AAR's) Change in South Asian stock from day 0 to 35 after the second wave of Corona
Event Window | PSX | NSE | DSE | CSE-All Shares | NEPSE | BSI | MATRIX | AFX |
0 | -0.0196642 | 0.0032294 | -0.00388666 | -0.00468 | 0.012275 | -0.00527 | -0.00118 | 0.001372 |
1 | 0.00353457 | 0.0005602 | -0.00302249 | 0.000295 | 0.000149 | 0.001183 | -0.00118 | -0.00192 |
2 | -0.0485733 | 0.0055056 | -0.0059241 | -0.00531 | 0.007464 | -0.00639 | -0.01341 | -0.00255 |
3 | -0.040797 | -0.020821 | 0.002068704 | -0.01398 | 0.01429 | -0.01061 | 0.038674 | 0.004804 |
4 | 0.03826763 | 0.0048511 | -0.00866133 | -8.3E-05 | -0.0045 | -0.00399 | -0.0016 | 0.000859 |
5 | -0.0192878 | -0.007143 | -0.00819763 | -0.00663 | -0.00829 | -0.02328 | -0.0016 | -0.00012 |
6 | 0.02102495 | 0.0051864 | 0.002175342 | -0.00018 | 0.011358 | 0.029196 | -0.0016 | 0.003805 |
7 | -0.0271388 | -0.005118 | -0.0036038 | 0.006687 | 0.028776 | -0.00185 | -0.0016 | -0.00294 |
8 | -0.004174 | -0.003539 | -0.01438733 | -0.00059 | 0.0009 | 0.007422 | -0.0016 | 0.01189 |
9 | -0.0099237 | 0.0052188 | -0.0073902 | 0.004516 | 0.02919 | 0.027782 | -0.0016 | 0.003019 |
10 | -0.0102554 | 0.0031985 | -0.00249283 | 0.009354 | 0.002481 | -0.01243 | -0.10028 | 0.000132 |
11 | -0.0310517 | -0.000868 | -0.0069797 | 0.010023 | -0.01143 | -0.01825 | 0.000111 | -0.00186 |
12 | -0.0038991 | 0.007032 | -0.01504927 | 0.001956 | 0.0213 | -0.01097 | 0.000111 | -0.00336 |
13 | -0.0083852 | -0.006887 | -0.01272481 | -0.0007 | -0.02276 | 0.013499 | -0.037 | 0.000242 |
14 | -0.0228759 | -0.000535 | 0.003849923 | 0.002702 | -0.07642 | -0.00226 | 0.000682 | -0.00353 |
15 | -0.0044961 | 8.632E-05 | -0.00241106 | 0.008168 | 0.027358 | -0.00092 | 0.000682 | 0.004233 |
16 | -0.0060268 | -0.002644 | 0.005483508 | 0.0097 | -0.0152 | 0.000769 | 0.000682 | -0.00299 |
17 | -0.0092904 | 0.0056673 | -0.0004694 | 0.0011 | -0.03 | -0.00226 | 0.000682 | 0.003223 |
18 | -0.0009237 | 0.0012855 | 0.003893401 | -0.00549 | -0.0035 | 0.019108 | 0.000682 | 0.001239 |
19 | -0.0189223 | -0.002405 | 0.002175433 | -0.00512 | 0.016736 | 0.027265 | 0.000682 | 0.003618 |
20 | 0.03195274 | -0.035475 | -0.00033826 | 0.000229 | 0.019811 | 0.01344 | 0.000682 | 0.003785 |
21 | 0.06052371 | 0.0086815 | -0.00116444 | -0.01011 | -0.01274 | 0.01683 | -0.00609 | -0.00202 |
22 | 0.00556423 | 0.0083284 | -0.00536643 | -0.0019 | -0.01168 | 0.016379 | 0.000786 | -0.00348 |
23 | 0.00405142 | 0.0078782 | -0.00538927 | -0.01041 | -0.01723 | 0.060347 | 0.000786 | -0.00658 |
24 | 0.00040437 | 0.0059728 | -0.00639862 | -0.00603 | -0.05357 | -0.03594 | 0.000786 | 0.000747 |
25 | 0.00458747 | 0.000725 | 0.001368589 | -0.00328 | 0.016657 | 0.000695 | 0.000786 | -0.00187 |
26 | -0.0062426 | 0.0003291 | 0.010004553 | -0.00153 | 0.048461 | 0.020067 | 0.000786 | 0.000976 |
27 | 0.01329322 | -0.003388 | 0.003904643 | -0.00407 | 0.001406 | -0.01114 | 0.000786 | 0.015681 |
28 | -0.0078582 | -0.003292 | 0.001550918 | 0.005546 | -0.01444 | -0.00738 | 0.000786 | 0.001219 |
29 | -0.0063035 | 0.0079573 | -0.0019513 | -0.00027 | -0.01926 | -0.01258 | 0.000786 | -0.013 |
30 | 0.00077871 | 0.0017246 | 0.004387635 | 0.003905 | 0.002061 | 0.062328 | 0.000786 | -0.00902 |
31 | -0.007809 | -0.006835 | -0.0040986 | 0.001902 | 0.002684 | 0.052472 | 0.000786 | -0.00728 |
32 | -0.0099471 | -0.002977 | 0.000755023 | 0.015863 | 0.023551 | 0.00066 | 0.000786 | 0.024531 |
33 | 0.01935507 | 0.0122255 | -0.0057868 | 0.00907 | 0.008628 | -0.05292 | 0.000786 | -0.01335 |
34 | 0.00851879 | 0.0063884 | -0.00304468 | 0.004433 | 0.037293 | -0.0364 | 0.046498 | 0.00121 |
35 | 0.01097162 | 0.0019392 | 0.004693591 | 0.004676 | -0.00818 | 0.018304 | -0.04433 | -0.00652 |
Figure 3
AAR after 2nd Wave of Covid-19
Table 9 shows the results of Change in CAAR's (Cumulative Average abnormal Returns) after the second wave of Corona in South Asian countries in the event window of 35 days. Results show that as after the announcement of the Second wave by the country 'official, only PSX (Pakistan Stock Exchange) shows the consistent negative cumulative abnormal returns while the rest of the stock market indices remain unaffected, and it did not result in negative cumulative abnormal returns for the investors as shown in fig 4.
Table 9. Cumulative Average Abnormal returns (CAAR's) Change in South Asian stock from day 0 to 35 after the second wave of Corona
Event Window | PSX | NSE | DSE | CSE-All Shares | NEPSE | BSI | MATRIX | AFX |
0 | -0.01931 | -0.01415 | -0.01677 | -0.00993 | 0.024069 | -0.01709 | -0.01346 | 0.00059 |
1 | -0.01613 | 0.00379 | -0.00691 | -0.00439 | 0.012424 | -0.00409 | -0.00236 | -0.0005 |
2 | -0.04504 | 0.006066 | -0.00895 | -0.00502 | 0.007613 | -0.00521 | -0.01458 | -0.0045 |
3 | -0.08937 | -0.01531 | -0.00386 | -0.01929 | 0.021754 | -0.017 | 0.025269 | 0.00226 |
4 | -0.00253 | -0.01597 | -0.00659 | -0.01406 | 0.009786 | -0.0146 | 0.037074 | 0.00566 |
5 | 0.01898 | -0.00229 | -0.01686 | -0.00671 | -0.01279 | -0.02727 | -0.0032 | 0.00074 |
6 | 0.001737 | -0.00196 | -0.00602 | -0.00681 | 0.00307 | 0.005919 | -0.0032 | 0.00368 |
7 | -0.00611 | 6.8E-05 | -0.00143 | 0.006508 | 0.040134 | 0.027343 | -0.0032 | 0.00086 |
8 | -0.03131 | -0.00866 | -0.01799 | 0.006098 | 0.029676 | 0.005568 | -0.0032 | 0.00895 |
9 | -0.0141 | 0.00168 | -0.02178 | 0.003927 | 0.030091 | 0.035204 | -0.0032 | 0.01491 |
10 | -0.02018 | 0.008417 | -0.00988 | 0.01387 | 0.031671 | 0.015357 | -0.10188 | 0.00315 |
11 | -0.04131 | 0.002331 | -0.00947 | 0.019377 | -0.00895 | -0.03068 | -0.10017 | -0.0017 |
12 | -0.03495 | 0.006164 | -0.02203 | 0.011979 | 0.009865 | -0.02923 | 0.000222 | -0.0052 |
13 | -0.01228 | 0.000145 | -0.02777 | 0.001255 | -0.00146 | 0.002524 | -0.03689 | -0.0031 |
14 | -0.03126 | -0.00742 | -0.00887 | 0.002002 | -0.09918 | 0.011237 | -0.03632 | -0.0033 |
15 | -0.02737 | -0.00045 | 0.001439 | 0.01087 | -0.04906 | -0.00318 | 0.001364 | 0.00071 |
16 | -0.01052 | -0.00256 | 0.003072 | 0.017867 | 0.012157 | -0.00015 | 0.001364 | 0.00124 |
17 | -0.01532 | 0.003024 | 0.005014 | 0.0108 | -0.0452 | -0.00149 | 0.001364 | 0.00023 |
18 | -0.01021 | 0.006953 | 0.003424 | -0.00439 | -0.03351 | 0.016847 | 0.001364 | 0.00446 |
19 | -0.01985 | -0.00112 | 0.006069 | -0.01061 | 0.013233 | 0.046373 | 0.001364 | 0.00486 |
20 | 0.01303 | -0.03788 | 0.001837 | -0.00489 | 0.036547 | 0.040705 | 0.001364 | 0.0074 |
21 | 0.092476 | -0.02679 | -0.0015 | -0.00988 | 0.00707 | 0.030271 | -0.00541 | 0.00177 |
22 | 0.066088 | 0.01701 | -0.00653 | -0.01201 | -0.02442 | 0.033209 | -0.0053 | -0.0055 |
23 | 0.009616 | 0.016207 | -0.01076 | -0.01232 | -0.02891 | 0.076726 | 0.001572 | -0.0101 |
24 | 0.004456 | 0.013851 | -0.01179 | -0.01645 | -0.0708 | 0.024409 | 0.001572 | -0.0058 |
25 | 0.004992 | 0.006698 | -0.00503 | -0.00931 | -0.03691 | -0.03524 | 0.001572 | -0.0011 |
26 | -0.00166 | 0.001054 | 0.011373 | -0.00481 | 0.065118 | 0.020762 | 0.001572 | -0.0009 |
27 | 0.007051 | -0.00306 | 0.013909 | -0.0056 | 0.049867 | 0.008927 | 0.001572 | 0.01666 |
28 | 0.005435 | -0.00668 | 0.005456 | 0.001474 | -0.01304 | -0.01852 | 0.001572 | 0.0169 |
29 | -0.01416 | 0.004665 | -0.0004 | 0.005275 | -0.0337 | -0.01996 | 0.001572 | -0.0118 |
30 | -0.00552 | 0.009682 | 0.002436 | 0.003634 | -0.0172 | 0.049747 | 0.001572 | -0.022 |
31 | -0.00703 | -0.00511 | 0.000289 | 0.005807 | 0.004746 | 0.1148 | 0.001572 | -0.0163 |
32 | -0.01776 | -0.00981 | -0.00334 | 0.017765 | 0.026235 | 0.053132 | 0.001572 | 0.01725 |
33 | 0.009408 | 0.009248 | -0.00503 | 0.024934 | 0.032178 | -0.05226 | 0.001572 | 0.01118 |
34 | 0.027874 | 0.018614 | -0.00883 | 0.013503 | 0.04592 | -0.08932 | 0.047284 | -0.0121 |
35 | 0.01949 | 0.008328 | 0.001649 | 0.009109 | 0.029108 | -0.01809 | 0.002163 | -0.0053 |
Figure 4
CAAR after the 2nd Wave of Covid-19
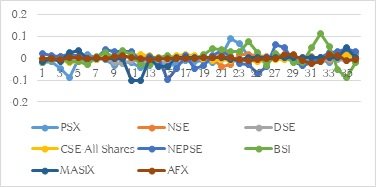
Table 10 shows the results of Change in AAR's (Average abnormal Returns) after the third wave of Corona in South Asian countries in the event window of 35 days. Results show that after the announcement of the third wave by the country 'official, only PSX (Pakistan Stock Exchange) and AFX (Afghanistan Stock Exchange) showed consistent negative returns while the rest of the stock market indices remained unaffected, and it did not result in negative abnormal returns for the investors as shown in fig 5.
Table 10. Average Abnormal returns (AAR's) Change in South Asian stock from day 0 to 35 after the second wave of Corona
Event Window | PSX | NSE | DSE | CSE-All Shares | NEPSE | BSI | MATRIX | AFX |
0 | -0.006109 | 0.0152875 | -0.00586244 | 0.0002898 | 0.002503 | -0.00438 | 1.141E-05 | -0.0008 |
1 | 0.00757221 | 0.0099645 | 6.46922E-05 | 0.0094826 | 0.012891 | -0.01912 | 1.141E-05 | -0.01527 |
2 | 0.01392139 | 0.0208933 | -0.00988844 | 0.0027663 | -0.01163 | 0.026675 | 1.141E-05 | -6E-05 |
3 | -0.0148026 | -0.011685 | 0.001551051 | 0.0079326 | -0.00536 | -0.00354 | 1.141E-05 | 0.014707 |
4 | 0.00517356 | -0.010287 | -0.00400491 | 0.0033169 | 0.00941 | 0.002889 | 1.141E-05 | -0.00048 |
5 | -0.0049163 | 0.0005148 | -0.01596578 | 0.0131303 | 0.013464 | 0.018481 | 1.141E-05 | -0.00022 |
6 | -0.0460048 | 0.0087741 | -0.01676201 | 0.0053512 | 0.001609 | -0.02007 | 1.141E-05 | -0.01494 |
7 | 0.02182907 | 0.0043464 | 0.010662947 | 0.0124794 | 0.006563 | -0.00706 | 1.141E-05 | -0.00074 |
8 | -0.007102 | -0.010234 | -0.00078199 | 0.0104185 | -0.00273 | -0.03469 | 1.141E-05 | 0.015034 |
9 | -0.0402912 | -0.007454 | -0.01671605 | -0.006704 | 0.002715 | -0.04606 | 1.141E-05 | -0.00049 |
10 | -0.0057161 | -0.001932 | -0.00160561 | -0.007164 | -0.0042 | 0.036053 | 1.141E-05 | -0.0005 |
11 | -0.028276 | -0.013418 | 0.002156098 | -0.027539 | -0.00202 | -0.01897 | -1.36E-05 | -0.01442 |
12 | 0.01240043 | -0.011808 | 0.004667324 | 0.009788 | 0.003469 | -0.0569 | -0.004769 | -4.9E-05 |
13 | -0.0002917 | 0.0120859 | -0.01858209 | -0.015117 | 0.005543 | 0.024601 | -1.66E-06 | -0.00055 |
14 | -0.000264 | -0.001197 | -0.00215303 | -0.013845 | 0.004505 | -0.04708 | -1.66E-06 | -0.00043 |
15 | 0.03187135 | 0.0046435 | -0.03572571 | -0.023958 | -0.01636 | 0.000372 | -0.001321 | 9.81E-05 |
16 | -0.024067 | -0.018732 | 0.016770767 | 0.0235287 | -0.01715 | 0.015771 | 1.662E-06 | 0.000196 |
17 | -0.0096047 | -0.016183 | 0.019341616 | -0.003964 | -0.00213 | 0.021901 | 1.662E-06 | -3.5E-05 |
18 | 0.00666271 | 0.012056 | 0.009906023 | -0.001921 | -0.0153 | -0.014 | 1.848E-05 | -0.00029 |
19 | -0.018993 | 0.0223985 | -0.01624913 | 0.0002893 | 0.00299 | 0.081962 | 1.848E-05 | 0.000995 |
20 | -0.0032323 | -0.011181 | -0.01791513 | -0.015279 | -0.03206 | -0.01508 | 4.173E-05 | -0.00083 |
21 | -0.0016054 | 0.0112419 | 0.003988423 | 0.0041645 | -0.02867 | 0.006815 | 4.173E-05 | 0.002725 |
22 | 0.06111331 | -0.016387 | 0.012871231 | 0.0051847 | 0.033567 | 0.00677 | 0.0028811 | -0.00213 |
23 | 0.02041201 | 0.0024238 | 0.009175044 | 0.0067538 | -0.00812 | -0.00711 | 3.458E-05 | 0.000371 |
24 | 0.00620073 | 0.0085164 | 0.003324684 | -0.015525 | 0.00712 | 0.013828 | -0.003973 | 0.014796 |
25 | 0.03365903 | 0.0029972 | 0.002767417 | 0.0003435 | 0.01763 | -0.01367 | 4.467E-05 | -0.00014 |
26 | 0.01900934 | -0.003337 | 0.012624787 | 0.0018357 | -0.00761 | -0.013 | 4.794E-05 | -0.0121 |
27 | -0.0010328 | -0.036689 | -0.00056338 | 0.0084783 | -0.00225 | 0.01576 | 0.0040558 | -0.00013 |
28 | 0.00487684 | 0.0128867 | 0.001342454 | 0.0159134 | -0.00489 | -0.03335 | 3.621E-05 | 0.011944 |
29 | -0.0046013 | 0.0046721 | 0.010792294 | -0.000205 | -0.00763 | 0.026926 | 0.0024603 | -0.00048 |
30 | 0.01636054 | 0.001869 | -0.00305112 | -0.002796 | -0.00994 | -0.00025 | 2.683E-05 | -0.00048 |
31 | -0.018817 | -0.018485 | -0.01235998 | -0.007 | 0.007519 | 0.006218 | 2.683E-05 | -0.01395 |
32 | 0.03152206 | -0.005008 | 0.006627063 | -0.011229 | 0.007497 | -0.0071 | 2.683E-05 | -0.00024 |
33 | 0.01611246 | 0.0070394 | 0.002807436 | 0.0009509 | -0.00256 | -0.01557 | 0.0162091 | 0.014337 |
34 | 0.02014355 | -0.005104 | 0.006233832 | 0.0052763 | 0.001016 | -0.01336 | -1.39E-05 | -0.00017 |
35 | 0.040502 | 0.0093731 | -0.00160506 | 0.007276 | 0.017256 | 0.028514 | -1.39E-05 | -0.0005 |
Figure 5
AAR's after 3rd Wave of Corona
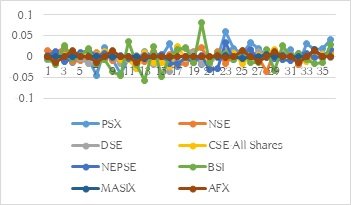
Figure 6
CAAR's after 3rd Wave of Corona
Cumulative Effect of COVID-19 on the South Asian stock indices
Table 12 shows the results of the impact of COVID-19 on the stock market indices of South Asian countries, along with its standard error and t-test values. Results show that all the countries' stock indices get affected by the first wave of COVID-19 because all the stock indices show the negative CAAR's except the AFX. Stock indices of PSX & NSE show the negative CAAR's for 13 and 19 days, respectively, while the rest of the stock indices show negative CAAR's for eight days. This negative effect of COVID-19 is not significant across all the indices. Its Indian stock market (NSE) only, which shows significant results. Therefore, among all the South Asian countries, Corona hit the Indian stock market badly.
Table 12. Cumulative Average Abnormal Returns (CAAR’s) after the first wave of Corona
Indexes | CAR | St. Error | t-Test | Overall Significance | Significant Days |
PSX | -0.0103098 | 0.032656 | -0.31571 | Insignificant | 13 days |
NSE | -0.00721966 | 0.007671 | -0.94118 | Significant | 19 days |
DSE | -0.00108752 | 0.01434 | -0.07584 | Insignificant | Eight days |
CSE-All Shares | -0.01051271 | 0.007909 | -1.32921 | Insignificant | 8 days |
NEPSE | -0.00936154 | 0.013829 | -0.67695 | Insignificant | 8 days |
BSI | -0.00535581 | 0.026598 | -0.20136 | Insignificant | 8 days |
MATRIX | -0.00078698 | 0.004422 | -0.17798 | Insignificant | 8 days |
AFX | 0.001023999 | 0.007206 | 0.1421 | Insignificant | 8 days |
Table 13 shows the results of the impact of the second wave of COVID-19 on the stock market indices of South Asian countries, along with its standard error and t-test values. Results show that only PSX, NSE, DSE & MASIX get affected by the second wave of COVID-19 because these stock indices show negative CAAR's while the rest of the stock market indices' CAAR remain positive. Stock indices of PSX, NEPSE & MASIX show the negative CAAR's for 2, 10, and 7 days respectively, while the rest of the stock indices did not show negative returns. This negative effect of COVID-19 is not significant across all the indices, which means this second wave of Corona did not affect the South Asian countries like its first wave because investors learned to cope with this dilemma over time.
Table 13. Cumulative Average Abnormal Returns (CAAR’s) after the Second wave of Corona
Indexes | CAR | St. Error | t-Test | Overall Significance | Significant Days |
PSX | -0.00590704 | 0.034086 | -0.1733 | Insignificant | 2 days |
NSE | -0.00042294 | 0.021013 | -0.02013 | Insignificant | No day |
DSE | -0.00506749 | 0.016789 | -0.30183 | Insignificant | No day |
CSE-All Shares | 0.000821468 | 0.014213 | 0.057796 | Insignificant | No day |
NEPSE | 0.001866567 | 0.018507 | 0.100858 | Insignificant | 10 days |
BSI | 0.006547053 | 0.025899 | 0.252789 | Insignificant | 5 days |
MATRIX | -0.00541355 | 0.011346 | -0.47714 | Insignificant | 7 days |
AFX | 0.000393246 | 0.006678 | 0.058882 | Insignificant | 6 days |
Table 14 shows the results of the impact of the third wave of COVID-19 on the stock market indices of South Asian countries, along with its standard error and t-test values. Results show that only MASIX is affected by the third wave of COVID-19 because its stock market index shows negative CAAR's while the rest of the stock market indices' CAAR remains positive. The stock index of Afghanistan shows consistent negative CAAR's for 20 days. This negative effect of COVID-19 is not significant across all the indices, which means this third wave of Corona did not affect the South Asian countries like its first wave because investors learn to cope with this dilemma with time.
Table 14. Cumulative Average Abnormal Returns (CAAR’s) after the Second wave of Corona
Indexes | CAR | St. Error | t-Test | Overall Significance | Significant Days |
PSX | -0.0126238 | 0.03098 | -0.4075 | Insignificant | No day |
NSE | -0.0029827 | 0.0193 | -0.1545 | Insignificant | 1 day |
DSE | -0.0023819 | 0.01388 | -0.1716 | Insignificant | 4 days |
CSE-All Shares | -4.845E-05 | 0.01542 | -0.0031 | Insignificant | 2 Days |
NEPSE | -0.0019973 | 0.01857 | -0.1076 | Insignificant | 1 Day |
BSI | -0.0030089 | 0.0259 | -0.1162 | Insignificant | 4 Days |
MATRIX | 0.00091104 | 0.01333 | 0.06835 | Insignificant | NO Day |
AFX | -0.0002806 | 0.00444 | -0.0632 | Insignificant | 20 Days |
Conclusion
The purport of this study was the check the impact of the first, second, and third waves of COVID-19 on the stock market indices of South Asian countries. This research integrates to the finance literature because it checks the instant impact of a disease on the stock market indices. The study is an endeavor to show the investment peril, which is caused by this disease for the financial markets and investors. The results show that COVID-19 decreases the mean returns of all the stock market indices and increases their volatility, which denotes that Corona does influence all the stock markets of South Asia in decrementing their returns and incrementing volatility. Then intriguingly, it is only the Pakistan Stock index, which shows both the consistent negative average and cumulative anomalous returns while the rest of the stock market indices remain unaffected.
The findings of this study are consistent with Sareen's. S, 2020, who find that Pakistan is one of the countries which is worst affected by COVID-19. Overall, the negative effect of the first wave of COVID-19 is not paramount across all the indices except the Indian stock market (NSE), while its second wave did not affect any of the stock market indices significantly. As far as the third wave is concerned then it affects the stock markets indices of Pakistan (PSX) and Afghanistan (AFX). These findings are consistent with Phan & Naryan (2020) find that initial over-reaction of investors was thereafter the first wave of Corona, and it is conspicuous from the data until April 2020, but they further find that initial negative reaction to the incipient cases and death rate of Corona patients is followed by a positive replication.
This shows that the Efficient Market hypothesis holds for the South Asian countries ‘stock markets because the first wave of Covid-19 affects the returns of the stock market, while the second wave did not affect any of the stock markets. The reason is that people respond only to that information, which is incipient and not publicly available, the first wave of Corona was incipient for the investors, so it affects the returns of the stock market, while the second wave was not incipient, and that is why it could not put any consequential impact on the returns. As far as the third wave is concerned, then it shows the paramount results again because people were not expecting a third wave after the second when it comes, it does affect the sentiments of investors and results in the decremented returns of the stock markets of Pakistan and Afghanistan. Afghanistan is the only stock market, which is astringently affected after the third wave of COVID-19. On the contrary, the stock markets of Bhutan remain impervious to the third wave as well. This is due to the health infrastructure and vigorous economy of Bhutan, which enable its stock markets to cope with this virus.
This virus became a plague for the developing countries of South Asia and our officials should not only focus their attention on resolving the health issues only but on financial issues as well because stock markets present the future earnings. The investors get panic under these dubious circumstances and that leaves them with the only option of selling the stock. In developing countries of South Asia, the factories are shutting down and cutting down their staff to abbreviate their activities, these results in the abbreviated profitability and liquidity quandaries for them. Consequently, our officials should cerebrate to abolish this panic situation of financial markets.
Policy Implications
An accumulation is required for all the investment bankers, central banks, and Regime officials to sit and endeavor to combat this challenge. Central banks should sanction banks to remain lenient in the instauration of impaired loans and roll over the current loans and should design special loans for the manufacturing, tourism, hoteling, and peregrinating sectors because these are affected rigorously by COVID-19.
Limitations of the Study
Firstly, the study has worked on a 35-days window only for checking the instant impact of COVID-19 on the stock market indices of South Asian countries only. Secondly, the study did not include demographic factors like gender, age, edification type of investors, securities, and other financial markets, etc. due to lack of data.
References
Cite this article
-
APA : Ishtiaq, M., Imtiaz, A., & Mushtaq, H. (2021). The Impact of different Waves of the COVID-19 Pandemic on the Stock Markets in South Asian Countries. <i>Global Social Sciences Review, VI(II)</i>, 238-253. <a href='https://doi.org/10.31703/gssr.2021(VI-II).24'>https://doi.org/10.31703/gssr.2021(VI-II).24</a>
-
CHICAGO : Ishtiaq, Muhammad, Aisha Imtiaz, and Hina Mushtaq. 2021. "The Impact of different Waves of the COVID-19 Pandemic on the Stock Markets in South Asian Countries." <i>Global Social Sciences Review</i>, VI (II): 238-253 doi: 10.31703/gssr.2021(VI-II).24
-
HARVARD : ISHTIAQ, M., IMTIAZ, A. & MUSHTAQ, H. 2021. The Impact of different Waves of the COVID-19 Pandemic on the Stock Markets in South Asian Countries. <i>Global Social Sciences Review</i>, VI, 238-253.
-
MHRA : Ishtiaq, Muhammad, Aisha Imtiaz, and Hina Mushtaq. 2021. "The Impact of different Waves of the COVID-19 Pandemic on the Stock Markets in South Asian Countries." <i>Global Social Sciences Review</i>, VI: 238-253
-
MLA : Ishtiaq, Muhammad, Aisha Imtiaz, and Hina Mushtaq. "The Impact of different Waves of the COVID-19 Pandemic on the Stock Markets in South Asian Countries." <i>Global Social Sciences Review</i>, VI.II (2021): 238-253 Print.
-
OXFORD : Ishtiaq, Muhammad, Imtiaz, Aisha, and Mushtaq, Hina (2021), "The Impact of different Waves of the COVID-19 Pandemic on the Stock Markets in South Asian Countries", <i>Global Social Sciences Review</i>, VI (II), 238-253
-
TURABIAN : Ishtiaq, Muhammad, Aisha Imtiaz, and Hina Mushtaq. "The Impact of different Waves of the COVID-19 Pandemic on the Stock Markets in South Asian Countries." <i>Global Social Sciences Review</i> VI, no. II (2021): 238-253. <a href='https://doi.org/10.31703/gssr.2021(VI-II).24'>https://doi.org/10.31703/gssr.2021(VI-II).24</a>