Abstract
This study examines the risk management solutions used in the banking sector to meet the many risks. The report also evaluates how conventional and Islamic banks in Pakistan manage risk. This study used primary sources. First, senior managers, risk managers, and chief risk officers from Islamic and normal banks fill out a questionnaire. 51 financial institutions responded. Data analysis uses descriptive statistics, cross-tabulations, t-tests, an ANOVA, and the LSD test. Regular banks' operational risk management strategies and stress test results differ from Islamic banks statistically. The study found no statistically significant difference between Islamic and conventional banks in how well they used risk management tools and systems, how much market risk VaR they used, how much credit risk exposure they had, how they reduced that risk, and how they analyzed their credit risk portfolios.
Key Words
Islamic Banks, Conventional Banks, Risks, Risk Management, Pakistan
Introduction
A risk can be defined as an uncertain future event that could have an effect on the goals that are being pursued. According to Kaplan and Garrick's (1981) definition of risk, it is present whenever the outcome is unsure. Risk is an inherent feature of the environment in which a variety of different companies carry out their operations. It takes into account both the good and the negative effects on the goals of the company. Although there is some degree of unpredictability in any firm, the nature of the operations that financial institutions engage in exposes them to certain kinds of risk (Khan and Ahmed, 2001).
Background
Because the activity in the financial sector is susceptible to both internal and external environmental influences, a significant level of uncertainty and risk is present. There is always an element of danger involved with financial dealings of any kind. The chance is often categorised using a few different approaches. First and foremost, it is necessary to differentiate between financial risk and business risk. in our own method, we break the chance down into its component parts, which are systematic risk and unsystematic risk. Despite the fact that banks have always been exposed to risk, active risk management in conventional banking (CB) did not begin until the early 1990s. This was especially true after the failure of the Barings PLC bank. This practice is still in its infancy in Islamic banking (IB), which began its global practical implementation in the 1970s. Despite this, the banking sector has been hit hard by the current subprime mortgage crisis, which resulted in a number of bank failures, losses of multiple billions of dollars, and write-offs across the globe. Because of this difficulty, the significance of effective risk management has become more apparent.
In Pakistan, we have two different kinds of banking systems: Islamic banking and conventional banking (Khattak, Ullah and Ullah, 2013). IBs adhere to the standards established by Shariah, which forbids them from earning interest; instead, their revenue comes from the profit obtained from trading. IBs are liable for losses along with both the lenders and the borrowers (Habib, 2015). Both international banks (IBs) and central banks (CBs) will have to contend with risks that fall into one of two categories: financial risks and non-financial hazards. Credit risk, liquidity risk, and market risk are the three subcategories that fall under the umbrella of financial risk. Non-financial risks, on the other hand, include legal risks, operational risks, and regulatory risks (Gleason et al., 2000).
Research Problem
Now a day’s, the concept of modernization has made life so much fast, due to which risk become so much higher in the financial and non-financial sectors. In the financial sector, banking become so much changed and is also gets affected by the modern environment so this is the reason that to mitigate the higher risk new techniques need to be introduced. People don’t want to take higher risks but they want to maximize their profits at the optimum level. For this rationale, risk management departments/institutions start to measure the risk levels and try to make new and modern techniques to mitigate them as much as possible because the risk is the only key factor which has a long life with the business and investments so as much as the business and investments are secured the investors get confidences regarding their profits and the business cycle will go on. Tohmatsu (2005) observe that the financial institution approach the slandered Basel II. KPMG International (2004) and Moore (2009) conduct a study and advised in their research that if a financial institution wants to save itself from crises they defiantly change the behaviour and culture under which risk management is going on. There are a group of studies which was conducted on risk management practices of conventional banks, such as Harahap (2003); Al-Tamimi and Al-Mazrooei (2007); Hossain (2008); Alam and Masukujjaman (2011); Oliveira et al. (2011); Anam et al. (2012); Savvides and Savvidou (2012)and Selma, Rim, Abdelghani and Rajhi (2013). On the other hand, there are few studies that were conducted on risk management practices of Islamic financial institutions, such as Sundararajan and Errico (2002); Hassan (2009); Khalid and Amjad (2012); Ariffin (2012) and Darmadi (2013). Mohd Ariffin (2005) conducts research based on risk reporting and disclosure in Islamic banks. Khan and Ahmad (2001) conduct research which is totally focused on the risk management of Islamic banks.
Research Questions
By keeping in view this research study explains the following research questions;
1. To what extent do banks in Pakistan use risk management strategies and procedures when dealing with various types of risks?
2. How do IBs and CBs differ from one another in terms of how much market risk they use?
3. To what extent do IBs and CBs use the results of stress testing differently?
4. How do IBs and CBs differ from one another in terms of how much credit risk exposure they use?
5. How do IBs and CBs differ from one another in their use of credit portfolio analysis techniques?
6. To what extent do IBs and CBs use credit risk reduction strategies differently?
7. How do IBs and CBs differ from one another in their use of operational risk management tools?
Literature Review
Khan and Ahmed (2001) conducted research into the methods of risk management utilized by Islamic financial institutions at the beginning of the twenty-first century. 17 Islamic financial institutions from each of the ten nations were chosen to participate in the research study so that the objectives of the study could be met. According to the findings of the study, it is not possible to hedge Murabah contracts easily by employing the various instruments and techniques associated with risk management. Al-Tamimi (2002) conducted research into the different risk management strategies that are utilized by commercial banks in the United Arab Emirates. A study that was based on Basel II, pillar 3, was carried out by Baumann and Nier in 2003. The goal of the study was to investigate transparency rules that make it easier for market participants to evaluate the worth of banks. Their findings indicate that a higher practice of disclosure leads to a rise in market value as well as the usefulness of company accounts in anticipating valuations and a reduction in stock volatility. An investigation into the methods of risk management utilized by Bangladesh's commercial banks was carried out by Alam and Masukujjaman (2011) in the context of their research project. One of the most important takeaways from the research was that financial institutions in Bangladesh use a three-layer risk management approach. Tafri, Rahman, and Umar (2011) completed a study that was quite similar to this one in order to examine comparative analysis of the risk management strategies utilized by Islamic and commercial banks. A study by Abedifar et al. (2012) was carried out by collecting 553 observations from 24 different nations. They have shown that Shariah-compliant institutions have a lower credit risk compared to regular banks, and they have also established that Islamic financial institutions are more stable than conventional financial institutions when it comes to the risk of insolvency. Khalid and Amjad (2012) investigated the risk management practices of Islamic banks by employing a variety of strategies for several categories of risk. The authors came to the conclusion that Islamic banks confront a number of hazards that are distinct from those posed by conventional banks due to the fact that Islamic banks offer a wider variety of products to the general public than conventional banks do. Zadeh and Eskandari (2012) have published the findings of a study that they did on the topic of financial risk disclosure information in Malaysian companies. According to the findings that they obtained, the level of financial risk disclosure in the Malaysian context is very low, with a score of 38 out of a possible 100 points. A study was carried out by Hussain and Al-Ajmi (2012) to investigate the contrast in the approaches to risk management that the Islamic banking system and the commercial banking system in Bahrain take. The conclusion that can be drawn from the findings of the study is that the levels of risk that Islamic banks in Bahrain are exposed to are noticeably higher than those of conventional banks. Said, D. (2013) conducted a study on the hazards that are present in Islamic banking systems in the MENA Region and how efficient they are. The purpose of this study is to analyse how Islamic banks' levels of risk and levels of efficiency are related to one another. The research conducted by Selma Mokni, Echchabi, Azouzi, and Rachdi (2014) looked into the specifics of how Islamic banks in the MENA region measure and deal with the various risks they face. The significance of this study lies in the fact that it entails conducting an investigation of the conventional methods of risk management utilized by Islamic financial institutions. Shariah law adheres to both conventional and Islamic financial institutions operating inside Bangladesh's banking system, which scales the management of liquidity risk. In this study, Rahman and Hasanul-Banna (2016) wanted to analyse the comparative comparison between the two banks as their primary objective. The model has already been developed by Akhter and Sadaqat (2011), and these researchers also employ the linear regression model that they developed. A research project on the credit risk management and appraisal procedure of Nagpur banks was carried out by Mishra and Naidu (2016). The researcher gains new knowledge on how theoretical financial analysis is recycled during the process of loan valuation thanks to this study. The researcher will make their decisions based on the process description, the rules, and the approach.
Research Hypothesis
By keeping in view previous studies, the following research hypothesis needed to be addressed.
H1: Is there a major difference between IBs and CBs in the extent to which market VaR is utilized?
H2: Is there a major difference between IBs and CBs in the extent to which stress test data are utilized?
H3: Is there a major difference between IBs and CBs in terms of credit risk exposure utilization?
H4: Is there a substantial difference between IBs and CBs in the extent to which credit portfolio analysis procedures are utilized?
H5: Is there a major difference between IBs and CBs in the extent to which credit risk mitigation techniques are utilized?
H6: Is there a substantial difference between IBs and CBs in terms of operational risk management tool utilization?
H7: Is there a major difference between IBs and CBs in terms of the adequacy of risk management systems and tools?
Research Methodology
The banking industry of Pakistan served as the subject population for this study. All of the banks in Pakistan that are authorised to provide Islamic and conventional banking services within the nation are included in the study's sample frame. For the purpose of generalising the findings of the study in regard to risk management, only the scheduled banks are being taken into consideration.
Results and Discussion
This part of the
analysis presents the approach applied by the banks to the market risk capital,
the extent of the use of market risk VaR and the use of the results resulting
from stress. Table 1 discusses the approach to market risk regulatory capital
used by conventional and Islamic banks in Pakistan.
Table 1. Approach Used
for Determining Market Risk Regulatory Capital
|
Approach |
CB (%) |
CB-IB (%) |
IB (%) |
Overall (%) |
|
Standard Approach |
88.9 |
90.9 |
100.0 |
90.2 |
|
Internal Model-Parametric VaR |
8.3 |
9.1 |
0.0 |
7.8 |
|
Internal Model-Historical Simulation VaR |
2.8 |
0.0 |
0.0 |
2.0 |
|
Internal Model-Monte Carlo VaR |
0.0 |
0.0 |
0.0 |
0.0 |
|
Simulation VaR |
0.0 |
0.0 |
0.0 |
0.0 |
|
* CB = Conventional Banks** CB-IB = Conventional
Banks with Islamic Windows/Branches *** IB = Islamic Banks |
||||
A standard
approach is mostly used by the IBs and CBs in Pakistan, with an overall 90.2
per cent, followed by internal model-Parametric VaR (7.8 per cent) and internal
model-Historical Simulation VaR (2.0 per cent). However, simulation VaR and
Internal model-Monte Carlo VaR are not used for determining. To measure the extent of VaR use of market risk in the
case of fixed interest, equity, asset-backed securities, foreign exchange,
commodity and catastrophe or other event-driven instruments, the following
applies to each type of bank: Table 2
Table 2. Frequency of
Responses for the Level of Usage of Market Risk VaR
|
Item |
Type
of Bank |
Responses (%) |
Mean |
||||
|
1 |
2 |
3 |
4 |
5 |
|||
|
Fixed Income |
CB CB-IB IB |
0.0 0.0 0.0 |
5.6 9.1 50.0 |
38.9 45.5 25.0 |
36.1 45.5 0.0 |
19.4 0.0 25.0 |
3.69 3.36 3.00 |
|
Foreign Exchange |
CB CB-IB IB |
5.6 0.0 0.0 |
2.8 0.0 0.0 |
27.8 18.2 25.0 |
44.4 72.7 75.0 |
19.4 9.1 0.0 |
3.69 3.91 3.75 |
|
Equity |
CB CB-IB IB |
0.0 0.0 0.0 |
0.0 0.0 0.0 |
5.6 9.1 25.0 |
47.2 45.5 75.0 |
47.2 45.5 0.0 |
4.42 4.36 3.75 |
|
Asset-Backed Securities |
CB CB-IB IB |
0.0 0.0 0.0 |
2.8 0.0 0.0 |
2.8 0.0 50.0 |
52.8 45.5 0.0 |
41.7 54.5 50.0 |
4.33 4.55 4.00 |
|
Commodity |
CB CB-IB IB |
2.8 0.0 0.0 |
22.2 27.3 25.0 |
30.6 27.3 25.0 |
36.1 36.4 50.0 |
8.3 9.1 0.0 |
3.25 3.27 3.25 |
|
Catastrophe or other event-driven instruments |
CB CB-IB IB |
30.6 18.2 50.0 |
25.0 36.4 25.0 |
22.2 18.2 0.0 |
19.4 27.3 25.0 |
2.8 0.0 0.0 |
2.39 2.55 2.00 |
Table 3. Results of
ANOVA for Market Risk VaR according to Types of Banks
|
Type of Banks |
N |
Mean |
F-statistics |
p-value |
Conclusion |
|
CB |
36 |
3.629 |
0.809 |
0.451 |
No
difference |
|
CB-IB |
11 |
3.665 |
|
|
|
|
IB |
4 |
3.290 |
|
|
|
|
* CB
= Conventional Banks** CB-IB = Conventional Banks with Islamic
Windows/Branches *** IB = Islamic Banks |
|||||
Table 3. The
findings presented in the table indicate that there is no statistically
significant difference between Islamic banks and conventional banks in terms of
the amount to which market risk VaR is used. Therefore, the first hypothesis,
which proposes that IBs and CBs employ market risk VaR in significantly
different ways, cannot be supported and must be rejected. The following table
illustrates how the results of stress tests are used: to communicate them to
top management; to understand the risk profile of the company; to determine
limitations; to initiate further analyses, and to allocate economic capital
according to the type of bank.
Table 4. Frequency of
Responses
|
Item |
Type
of Bank |
Responses (%) |
Mean |
||||
|
1 |
2 |
3 |
4 |
5 |
|||
|
Reporting to senior management |
CB CB-IB IB |
0.0 0.0 0.0 |
0.0 0.0 0.0 |
8.3 9.1 0.0 |
61.1 63.6 75.0 |
30.6 27.3 25.0 |
4.22 4.18 4.25 |
|
Understanding a firm’s risk profile |
CB CB-IB IB |
0.0 0.0 0.0 |
2.8 0.0 0.0 |
13.9 27.3 75.0 |
61.1 54.5 25.0 |
22.2 18.2 0.0 |
4.03 3.91 3.25 |
|
Setting limits |
CB CB-IB IB |
0.0 0.0 0.0 |
2.8 0.0 0.0 |
13.9 9.1 0.0 |
47.2 27.3 25.0 |
36.1 63.6 75.0 |
4.17 4.55 4.75 |
|
Triggering further analytics |
CB CB-IB IB |
0.0 0.0 0.0 |
0.0 0.0 50.0 |
25.0 36.4 0.0 |
44.4 18.2 25.0 |
30.6 45.5 25.0 |
4.06 4.09 3.25 |
|
Allocating economic capital |
CB CB-IB IB |
2.8 0.0 0.0 |
8.3 0.0 25.0 |
16.7 18.2 50.0 |
55.6 45.5 25.0 |
16.7 36.4 0.0 |
3.75 4.18 3.00 |
Table 5. Results of
ANOVA for Usage of Stress testing across bank Types
|
Type
of Banks |
N |
Mean |
F-statistics |
p-value |
Conclusion |
|
CB |
36 |
4.044 |
1.162 |
0.032 |
Significant
difference |
|
CB-IB |
11 |
4.281 |
|
|
|
|
IB |
4 |
3.700 |
|
|
|
|
* CB
= Conventional Banks** CB-IB = Conventional Banks with Islamic
Windows/Branches *** IB = Islamic Banks |
|||||
Table 6. LSD Test for
the Usage of Stress Testing Results across Bank Types
|
LSD
Test |
Type
of Bank |
CB |
CB-IB |
IB |
|
Usage of Stress Testing Results |
CB |
1.000 |
.465 |
.234 |
|
CB-IB |
.465 |
1.000 |
.134 |
|
|
IB |
.234 |
.134 |
1.000 |
|
|
* CB = Conventional Banks** CB-IB = Conventional
Banks with Islamic Windows/Branches *** IB = Islamic Banks |
||||
The table gives
an overview of the frequency of stress testing usage in the Trading and Banking
book. The majority of the banks use stress resulting for both trading and
banking books on a monthly basis with 52.9 per cent and 64.7 per cent
respectively followed by the quarterly usage of stress testing frequency.
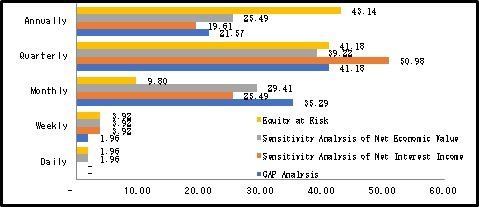
Figure 1
Frequency of Analysis Used for ALM Reporting Purposes (in %age)
Credit Risk Management
Figure 2 shows the frequency of internal rating benchmarking being employed by the Islamic and conventional banks with or without Islamic branches in the banking sector of Pakistan. The majority of the banks benchmark internal ratings on a quarterly basis (64.7 per cent), followed by semi-annual benchmarking (21.6 per cent) and annually (9.8 per cent). Only one bank does not internal rating benchmark.
Figure 2
Frequency of Internal Rating Benchmarking by your Bank (in %age)

88.9 per cent of
traditional banks use the standardized approach, 5.6 per cent the foundation
approach, and another 5.6 per cent the advanced internal rating approach.
Table 7. Approach Used for Calculating Capital Regulatory Requirement for Credit
Risk across Types of Banks
|
Item |
CB (%) |
CB-IB (%) |
IB (%) |
Overall (%) |
|
Standardized Approach |
88.9 |
90.9 |
100.0 |
19.6 |
|
Foundation Approach |
5.6 |
9.1 |
0.0 |
29.4 |
|
Advanced Approach |
5.6 |
0.0 |
0.0 |
51.0 |
|
* CB = Conventional Banks ** CB-IB =
Conventional Banks with Islamic Windows/Branches *** IB = Islamic Banks |
||||
Table 8. Distribution of
Usage of Own Credit Risk Models Across Bank Types
|
Item |
CB (%) |
CB-IB (%) |
IB (%) |
Overall (%) |
|
Yes, we are ready |
22.2 |
9.1 |
25.0 |
19.6 |
|
Yes, but we are not ready |
27.8 |
27.3 |
50.0 |
29.4 |
|
No |
50.0 |
63.6 |
25.0 |
51.0 |
|
* CB = Conventional Banks** CB-IB = Conventional
Banks with Islamic Windows/Branches *** IB = Islamic Banks |
||||
Table 9. Frequency of
Responses of Method Used in Managing Credit Risk Exposure Methods
|
|
|
Responses (%) |
|
||||
|
Item |
Type
of Bank |
1 |
2 |
3 |
4 |
5 |
Mean |
|
Principal/notional |
CB CB-IB IB |
0.0 0.0 0.0 |
5.6 0.0 0.0 |
16.7 18.2 75.0 |
58.3 81.8 25.0 |
19.4 0.0 0.0 |
3.92 3.82 3.25 |
|
Potential exposure by counterparty/issuer |
CB CB-IB IB |
0.0 0.0 0.0 |
2.8 0.0 0.0 |
19.4 27.3 25.0 |
61.1 63.6 75.0 |
16.7 9.1 0.0 |
3.92 3.82 3.75 |
|
Sum of potential exposures for individual transactions |
CB CB-IB IB |
0.0 0.0 0.0 |
5.6 0.0 0.0 |
22.2 9.1 33.3 |
61.1 90.9 20.0 |
11.1 0.0 0.0 |
3.78 3.91 3.67 |
|
Potential exposure net of collateral or margin |
CB CB-IB IB |
0.0 0.0 0.0 |
2.9 0.0 25.0 |
17.1 20.0 25.0 |
54.3 80.0 25.0 |
25.7 0.0 25.0 |
4.03 3.80 3.50 |
|
Potential exposure with netting |
CB CB-IB IB |
0.0 0.0 0.0 |
5.6 0.0 50.0 |
30.6 18.2 25.0 |
55.6 81.8 0.0 |
8.3 0.0 25.0 |
3.67 3.82 3.00 |
|
Principal plus fixed percentage |
CB CB-IB IB |
0.0 0.0 0.0 |
8.3 0.0 0.0 |
22.2 36.4 25.0 |
41.7 63.6 75.0 |
27.8 0.0 0.0 |
3.89 3.64 3.75 |
|
Potential exposure net of collateral or margin
by simulation of both market and credit risks |
CB CB-IB IB |
0.0 0.0 0.0 |
0.0 0.0 0.0 |
19.4 18.2 25.0 |
41.7 54.5 75.0 |
38.9 27.3 0.0 |
4.19 4.09 3.75 |
Table 10. Reaction Rates
to Questions about Credit Portfolio Analysis
|
|
|
Responses (%) |
|
||||
|
Item |
Type
of Bank |
1 |
2 |
3 |
4 |
5 |
Mean |
|
Credit concentration analysis |
CB CB-IB IB |
0.0 0.0 0.0 |
0.0 0.0 0.0 |
2.8 0.0 25.0 |
52.8 63.6 50.0 |
44.4 36.4 25.0 |
4.42 4.36 4.00 |
|
Portfolio mark-to-market (MTM) |
CB CB-IB IB |
0.0 0.0 0.0 |
2.8 9.1 0.0 |
27.8 63.6 0.0 |
30.6 27.3 75.0 |
38.9 0.0 25.0 |
4.06 3.18 4.25 |
|
Analyzing the potential for loss in light of
unforeseen fluctuations in MTM and credit ratings |
CB CB-IB IB |
0.0 0.0 0.0 |
5.6 9.1 25.0 |
41.7 54.5 50.0 |
41.7 36.4 0.0 |
11.1 0.0 25.0 |
3.58 3.27 3.25 |
|
Examining the potential for loss in light of the
present MTM and the typical rate of change in credit ratings |
CB CB-IB IB |
0.0 0.0 0.0 |
11.4 9.1 25.0 |
40.0 63.6 50.0 |
25.7 27.3 25.0 |
22.9 0.0 0.0 |
3.60 3.18 3.00 |
|
Risk/reward optimization |
CB CB-IB IB |
0.0 0.0 0.0 |
5.6 0.0 0.0 |
16.7 9.1 25.0 |
41.7 45.5 50.0 |
36.1 45.5 25.0 |
4.08 4.36 4.00 |
|
Portfolio transfer pricing |
CB CB-IB IB |
0.0 0.0 0.0 |
16.7 0.0 0.0 |
16.7 9.1 0.0 |
33.3 45.5 100.0 |
33.3 45.5 0.0 |
3.83 4.36 4.00 |
Table 11. Credit Risk
Mitigation Method Response Frequency
|
|
|
Responses (%) |
|
||||
|
Item |
Type
of Bank |
1 |
2 |
3 |
4 |
5 |
Mean |
|
Collateral |
CB CB-IB IB |
0.0 0.0 0.0 |
0.0 0.0 0.0 |
2.8 0.0 25.0 |
33.3 36.4 25.0 |
63.9 63.6 50.0 |
4.61 4.64 4.25 |
|
Guarantees |
CB CB-IB IB |
0.0 0.0 0.0 |
2.8 0.0 25.0 |
5.6 9.1 0.0 |
27.8 36.4 25.0 |
63.9 54.5 50.0 |
4.53 4.45 4.00 |
|
Syndication and Participation |
CB CB-IB IB |
0.0 0.0 0.0 |
8.3 0.0 25.0 |
30.6 27.3 25.0 |
27.8 45.5 50.0 |
33.3 27.3 0.0 |
3.86 4.00 3.25 |
|
On balance sheet netting |
CB CB-IB IB |
0.0 0.0 0.0 |
5.6 0.0 0.0 |
16.7 18.2 25.0 |
22.2 18.2 25.0 |
27.8 36.4 25.0 |
3.56 3.73 3.50 |
|
Off-balance sheet netting |
CB CB-IB IB |
8.3 0.0 50.0 |
25.0 18.2 0.0 |
19.4 27.3 0.0 |
27.8 18.2 50.0 |
19.4 36.4 0.0 |
3.25 3.73 2.50 |
|
Asset securitization vehicles |
CB CB-IB IB |
0.0 0.0 0.0 |
5.6 0.0 25.0 |
16.7 18.2 25.0 |
61.1 81.8 25.0 |
16.7 0.0 25.0 |
3.89 3.82 3.50 |
|
Credit insurance programs |
CB CB-IB IB |
0.0 0.0 0.0 |
13.9 0.0 0.0 |
11.1 0.0 50.0 |
55.6 81.8 50.0 |
19.4 18.2 0.0 |
3.81 4.18 3.50 |
|
Credit derivatives (including synthetic CDOs) |
CB CB-IB IB |
5.7 0.0 0.0 |
31.4 36.4 0.0 |
28.6 27.3 50.0 |
22.9 27.3 25.0 |
11.4 9.1 25.0 |
3.03 3.09 3.75 |
Table 11. The
ANOVA results in the table also demonstrate that there are no appreciable
differences between commercial banks and Islamic banks in terms of how credit
risk exposure, loan portfolio analysis, and credit risk mitigation are used. As
a result, H3, H4, and H5 assert that Islamic and conventional banks apply
different approaches to credit risk exposure, loan portfolio analysis, and
credit risk reduction, respectively.
Table 12. ANOVA of credit risk exposure, portfolio analysis, and
mitigation methods across bank types.
|
|
Type
of Banks |
N |
Mean |
F-statistics |
p-value |
Conclusion |
|
Credit Risk Exposure Methods |
CB |
36 |
3.912 |
1.435 |
0.248 |
No difference |
|
CB-IB |
11 |
3.837 |
||||
|
IB |
4 |
3.789 |
||||
|
Credit Portfolio Analysis Techniques |
CB |
36 |
3.827 |
0.479 |
0.623 |
No difference |
|
CB-IB |
11 |
3.787 |
||||
|
IB |
4 |
3.750 |
||||
|
Credit Risk Mitigation Methods |
CB |
36 |
3.88 |
0.660 |
0.522 |
No difference |
|
CB-IB |
11 |
3.956 |
||||
|
IB |
4 |
3.695 |
||||
|
* CB = Conventional Banks ** CB-IB =
Conventional Banks with Islamic Windows/Branches *** IB = Islamic Banks |
||||||
The results for
the three distinct kinds of financial institutions were averaged and compared
using an ANOVA test. These findings are presented in table 12, which also
illustrates the statistically significant difference in tool usage at the 10%
level.
Table 13. Analyzing the
Variance Test Outcomes for Operational Risk Management Tool Adoption across
Bank Types
|
Type
of Banks |
N |
Mean |
F-statistics |
p-value |
Conclusion |
|
CB |
36 |
3.738 |
3.793 |
0.077* |
Significant
difference |
|
CB-IB |
11 |
3.600 |
|||
|
IB |
4 |
3.145 |
|||
|
* CB
= Conventional Banks ** CB-IB = Conventional Banks with Islamic
Windows/Branches *** IB = Islamic Banks * The
mean difference is significant at the 0.10 level |
|||||
According to the
results of the further analyses presented in Table 4.17, H6 cannot be dismissed
since there is a statistically significant difference between the use of
Islamic banks and both types of traditional banks. As seen in Table 4.17, there
is a notable variation in the prevalence of using conventional banks, as shown
by the following analyses described therein. The conclusion that conventional
banks are more advanced than Islamic banks in using these technologies can be
drawn. This is because the aforementioned resources are superior in nature.
Table 14. Result of LSD
Test for the Usage of Operational Risk Management according to Types of Banks
|
LSD
Test |
Type
of Bank |
CB |
CB-IB |
IB |
|
Operational Risk Management |
CB |
1.000 |
0.510 |
0.070* |
|
CB-IB |
0.510 |
1.000 |
0.206 |
|
|
IB |
0.070* |
0.206 |
1.000 |
|
|
* CB = Conventional Banks ** CB-IB =
Conventional Banks with Islamic Windows/Branches *** IB = Islamic Banks * The mean difference is significant at the 0.10
level |
||||
The
respondents believed that the following are the factors that motivate banks to
undertake operational risk management practices.
§
Response to the regulatory activity
§
Undertaking operational activity develops a competitive edge over the
competitors
§
Response to audit requirements
§
Reaction to loss events, either internal or external
Table 15
represents the phase of implementation of operational risk management in the selected
scheduled banks. Only one bank is not implementing operational risk management
practices currently.
Table
15. A phase of Implementation of Operational Risk
Management in your Bank
|
Freq. |
% |
Cum.
% |
|
|
Not implementing operational risk management |
1 |
2 |
2 |
|
Phase 1: identifying operational risk types and
data gathering |
4 |
7.8 |
9.8 |
|
Phase 2: standardized documentation of processes
and controls |
20 |
39.2 |
49 |
|
Phase 3: creating metrics for monitoring each
type of operational risk |
13 |
25.5 |
74.5 |
|
Phase 4: Develop technologies for the quantification
of risks |
8 |
15.7 |
90.2 |
|
Phase 5: ongoing management of operational risk |
5 |
9.8 |
100 |
|
Total |
51 |
100 |
Table 16.
Operational Risk Management Structure does
your Bank Characterize
|
|
Frequency |
% |
Cumulative % |
|
Management
and Board of Directors Involved in an Objective Audit of Operational Risk |
20 |
39.2 |
39.2 |
|
Control
function for operational risks that is independent of the board and senior
management, which participates only little |
16 |
31.4 |
70.6 |
|
Operational
risk management is the responsibility of business units with no independent
oversight |
13 |
25.5 |
96.1 |
|
The
organization does not place a significant amount of emphasis on operational
risk management. |
2 |
3.9 |
100.0 |
|
Total |
51 |
100.0 |
|
Adequacy of the Tools and Systems Used for Risk Management
Table 17. Statistics that
provide a descriptive account of the degree to which banks' risk management
tools and systems are adequate
|
Statement |
N |
Mean |
S.D. |
t-stats |
p-value |
|
Bank's risk monitoring and reporting |
51 |
3.90 |
.608 |
45.799 |
.000 |
|
Bank's real-time risk monitoring and reporting |
51 |
3.96 |
.528 |
53.605 |
.000 |
|
Bank's internal risk management communication
channels? |
51 |
4.04 |
.662 |
43.564 |
.000 |
|
Bank's external communication channels in risk
management? |
51 |
3.86 |
.800 |
34.461 |
.000 |
|
Process integration and risk analytics-savvy IT
pros |
51 |
3.49 |
.905 |
29.078 |
.000 |
|
Human capital in risk measurement |
51 |
3.86 |
.825 |
33.433 |
.000 |
|
Human capital in risk measurement |
51 |
3.86 |
.872 |
31.626 |
.000 |
|
Training of bank employees in risk management
techniques |
51 |
3.82 |
.953 |
28.652 |
.000 |
|
Human capital training on Islamic business
ethics and culture |
51 |
3.56 |
.790 |
34.048 |
.000 |
|
personnel of the bank have a grasp of the many
categories of risks faced by the bank |
50 |
3.94 |
.843 |
33.049 |
.000 |
|
IT systems to cater for each Islamic instruments
|
51 |
3.66 |
.815 |
33.005 |
.000 |
Table 18. The findings of
an analysis of variance conducted on the appropriateness of risk management
tools and systems in relation to risk management practices in banks are shown
here.
|
Type
of Banks |
N |
Mean |
F-statistics |
p-value |
Conclusion |
|
CB |
36 |
3.874 |
0.432 |
0.652 |
No
difference |
|
CB-IB |
11 |
3.894 |
|||
|
IB |
4 |
3.535 |
|||
|
* CB = Conventional Banks ** CB-IB =
Conventional Banks with Islamic Windows/Branches *** IB = Islamic Banks |
|||||
Respondents Profile
Table 19 shows
how many genders respondents filled out the research questionnaire. In this
survey, 80.4 per cent of the respondents are men, while the remaining 19.6 per cent
are women, who provide valuable suggestions and feedback regarding the study.
Table 19. Gender
|
|
Frequency |
Per cent |
Cumulative Percent |
|
Male |
41 |
80.4 |
80.4 |
|
Female |
10 |
19.6 |
100.0 |
|
Total |
51 |
100.0 |
|
Table 20 below
shows the respondent’s age profile that filled the instrument for the data
collection. The major crunch of respondents belongs to the age group of 35-44
years and the second highest percentage is of respondents belonging to the age
group 25-34 which shows that most experienced personnel filled the instrument.
There is 29.4 per cent of respondents aged between 25-34 years, 68.6 per cent of
respondents fall in the age group of 35 to 44 years, and 2.0 per cent in the
age group of 55 to 64 years.
Table 20.
Age Range (in years)
|
|
Frequency |
Per cent |
Cumulative Percent |
|
25-34 |
15 |
29.4 |
29.4 |
|
35-44 |
35 |
68.6 |
98.0 |
|
55-64 |
1 |
2.0 |
100.0 |
|
Total |
51 |
100.0 |
|
The profile of
the respondents relating to their educational qualifications is given in the
table below. The majority of the respondents, almost 90 per cent have a Master's
degree or above, while 10 per cent of respondents have a bachelor’s degree.
This shows that respondents who had a higher level of education are more
careers oriented in the risk management department of the banks.
Table 21.
Highest Level of Education Achieved
|
|
Frequency |
Per cent |
Cumulative Percent |
|
Bachelor's Degree |
5 |
9.8 |
9.8 |
|
Master's Degree or Above |
46 |
90.2 |
100.0 |
|
Total |
51 |
100.0 |
|
30 respondents
have a finance background, 9 respondents have accounting expertise, 5 with
economics and 6 respondents have business administration specialization.
Whereas out of 51 respondents, 39 respondents have CFA and 12 have also got FRM
professional qualifications besides a master's/bachelor’s degree.
Table
22. Qualification Specialization
|
|
Frequency |
Per cent |
Cumulative Percent |
|
Finance |
30 |
58.8 |
58.8 |
|
Accounting |
9 |
17.6 |
76.5 |
|
Economics |
5 |
9.8 |
86.3 |
|
Business Administration |
6 |
11.8 |
98.0 |
|
Actuarial Science |
1 |
2.0 |
100.0 |
|
Total |
51 |
100.0 |
|
Table
23. Professional Qualification
|
|
Frequency |
Per cent |
Cumulative Percent |
|
CFA |
39 |
76.5 |
76.5 |
|
FRM |
12 |
23.5 |
100.0 |
|
Total |
51 |
100.0 |
|
Conclusion and Recommendation
Conclusion
Preventing risk is better than anticipating it. Excellent risk management identifies and treats risks. Banking risk management is crucial. Because the institution wants to maximize profits and shareholder value. Wealth maximization requires risk management. Many institutions are rethinking risk management models. A risk management strategy and framework were developed, and the institution's willingness to take risks was authorized. The purpose of risk management is to minimize losses and enhance gains. Pakistan is home to two separate financial institutions. In contrast to conventional banking, Islamic banking is based on sharia law and operates without charging interest. Traditional banks generate money by lending it out and passing on the risk to their customers in the form of interest. Adequate capacity to survive and manage risks is also vital for banks to efficiently finance economic activities, especially the duty of providing credit to a large number of firms whose operations support the economic process. Risk management practices of conventional and Islamic banks in Pakistan are compared in this research., including market, credit, and operational risks. This study compares Islamic and normal banks' use of VaR, stress testing outcomes, credit risk mitigation measures, and operational risk management tools. This research also studies Islamic banking's risk management methods and procedures, especially human capital capacity in risk measurement.
The population of the study is the banking (Islamic and Conventional) sector of Pakistan. The sample frame for the study is all scheduled banks of Pakistan to control Islamic and standard banking services within the country. The sample relies on 26 banks operating in Pakistan. the first data is employed for addressing the research problem and fulfilling the objectives of the study. Data for the study is gathered by questionnaires from scheduled banks of Pakistan from risk managers, heads of risk departments and from risk officers. a complete of 51 questionnaires are dully filled to be conducive for generalizing the findings. In the data collecting process, preference is given to those that are concerned with risk and appointed at managerial/officer rank.
The findings of the research study suggested that Islamic and standard banks have statistically no difference between the usage extents of market risk Var. However, the study found significant differences among the strain resulting results usage practices of conventional with or without Islamic branches/windows and Islamic banks. For credit risk management and mitigation techniques in the banking sector of Pakistan, according to the findings, conventional and Islamic financial institutions do not differ from one another in the degree to which they use credit risk exposure. In addition, researchers discovered that the utilization of credit risk mitigation approaches and credit risk portfolio analysis techniques was not statistically distinct between Pakistan's Islamic and conventional banking streams. When it comes to the management of operational risks, there is a large gap between Islamic banks and conventional banks in terms of the extent to which operational risk management methods are utilized. The study also came to the conclusion that there was not a statistically significant difference between traditional and Islamic banks in Pakistan in terms of the level of adequate risk management tools and processes. This was one of the findings of the study.
References
- Abdullah, M., Shahimi, S., & Ghafar Ismail, A. (2011). Operational risk in Islamic banks: examination of issues. Qualitative Research in Financial Markets, 3(2), 131–151.
- Abiola, I., & Olausi, A. S. (2014). The Impact of Credit Risk Management on the Commercial Banks Performance in Nigeria. International Journal of Management and Sustainability, 3(5), 295–306.
- Abraham, S., & Cox, P. (2007). Analysing the determinants of narrative risk information in UK FTSE 100 annual reports. The British Accounting Review, 39(3), 227–248.
- Abu Hussain, H., & Alâ€Ajmi, J. (2012). Risk management practices of conventional and Islamic banks in Bahrain. The Journal of Risk Finance, 13(3), 215–239.
- Ahmad, N. H., & Ahmad, S. N. (2004). Key Factors Influencing Credit Risk of Islamic Bank: A Malaysian Case. The Journal of Muamalat and Islamic Finance Research, 1(1), 65-80.
- Ahmed, H., & Khan, T. (2007). 10 Risk management in Islamic banking. Handbook of Islamic banking, 144.
- Ahmed, N., Ahmed, Z., & Usman, A. (2011). Determinants of performance: A case of life insurance sector of Pakistan. International Research Journal of Finance and Economics, 61(1), 123-128.
- Ahmed, N., Akhtar, M. F., & Usman, M. (2011). Risk management practices and Islamic banks: An empirical investigation from Pakistan. Interdisciplinary Journal of Research in Business, 1(6), 50-57.
- Ahmed, S. (2009). Risk Management in Islamic and Conventional Banks: A Differential Analysis. Journal of Independent Studies and Research-Management, Social Sciences andEconomics, 7(2), 67–79.
- Akhtar, M. F., Ali, K., & Sadaqat, S. (2011). Liquidity risk management: a comparative study between conventional and Islamic banks of Pakistan. Interdisciplinary Journal of Research in Business, 1(1), 35-44.
- Alam, M. Z., & Musukujjaman, M. (1970). Risk Management Practices: A Critical Diagnosis of Some Selected Commercial Banks in Bangladesh. Journal of Business and Technology (Dhaka), 6(1), 15–35.
- Al-Tamimi, H. A. H. (2002). Risk management practices: an empirical analysis of the UAE commercial banks. Finance India, 16(3), 1045-1057.
- Anam, S., Hasan, S., & Huda, H. AE., Uddin, A., Hossain, MM 2012. Liquidity Risk Management: A Comparative Study between Conventional and Islamic Banks of Bangladesh. Research Journal Economics, Business, ICT, 5, 1-5.
- Ariffin, N. M. (2005). Enhancing transparency and risk reporting in Islamic banks (Doctoral dissertation, School of Management, University of Surrey).
- Ariffin, N. M. (2012). Liquidity risk management and financial performance in Malaysia: empirical evidence from Islamic banks. Aceh International Journal of Social Science, 1(2).
- Arunkumar, R., & Kotreshwar, G. (2005). Risk management in commercial banks. In Paper submitted to Ninth Capital Market Conference, Indian Institute of Capital Market.
- Asongu, S. A. (2013). Postâ€crisis bank liquidity risk management disclosure. Qualitative Research in Financial Markets, 5(1), 65–84.
- Bain, K., & Howells, P. (1999). The Privatization of Monetary Policy. Money and Macroeconomic Policy, 1, 53.
- Baumann, U., & Nier, E. (2003). Market discipline and financial stability: some empirical evidence. Financial Stability Review, 14, 134- 141.
- Bell, E., & Bryman, A. (2007). The Ethics of Management Research: an Exploratory Content Analysis. British Journal of Management, 18(1), 63–77.
- Ben Selma Mokni, R., Echchabi, A., Azouzi, D., & Rachdi, H. (2014). Risk management tools practiced in Islamic banks: evidence in MENA region. Journal of Islamic Accounting and Business Research, 5(1), 77–97.
- Beretta, S., & Bozzolan, S. (2004). A framework for the analysis of firm risk communication. The International Journal of Accounting, 39(3), 265–288.
- Bryman, A., & Bell, E. (2003). Breaking down the quantitative/qualitative divide. Business Research Methods, 465-478.
- Habib, A. (2015). A comparison of Financial Performance of banking Industry in Pakistan. Journal of Poverty, Investment and Development, 13, 1-10.
- Habib, S., Masood, H., Hassan, T., Mubin, M., & Baig, U. (2014). Operational risk management in corporate and banking sector of Pakistan.
- Hakim, S., & Neaime, S. (2005). Profitability and Risk Management in Banking: A Comparative Analysis of Egypt and Lebanon. In Money and Finance in the Middle East: Missed Oportunities or Future Prospects? (pp. 117-131). Emerald Group Publishing Limited.
- Haneef, S., Riaz, T., Ramzan, M., Rana, M. A., Hafiz, M. I., & Karim, Y. (2012). Impact of risk management on non-performing loans and profitability of banking sector of Pakistan. International Journal of Business and Social Science, 3(7), 307-315.
- Hanim Tafri, F., Abdul Rahman, R., & Omar, N. (2011). Empirical evidence on the riskmanagement tools practised in Islamic and conventional banks. Qualitative Research in Financial Markets, 3(2), 86–104.
Cite this article
-
APA : Khan, M. M. S., Abid, S. K., & Tashfeen, R. (2022). Risk Managing Technique in Pakistan Industry: A Case from Pakistan. Global Social Sciences Review, VII(II), 463-478. https://doi.org/10.31703/gssr.2022(VII-II).45
-
CHICAGO : Khan, Muhammad Mahmood Shah, Sheikh Khurram Abid, and Rubeena Tashfeen. 2022. "Risk Managing Technique in Pakistan Industry: A Case from Pakistan." Global Social Sciences Review, VII (II): 463-478 doi: 10.31703/gssr.2022(VII-II).45
-
HARVARD : KHAN, M. M. S., ABID, S. K. & TASHFEEN, R. 2022. Risk Managing Technique in Pakistan Industry: A Case from Pakistan. Global Social Sciences Review, VII, 463-478.
-
MHRA : Khan, Muhammad Mahmood Shah, Sheikh Khurram Abid, and Rubeena Tashfeen. 2022. "Risk Managing Technique in Pakistan Industry: A Case from Pakistan." Global Social Sciences Review, VII: 463-478
-
MLA : Khan, Muhammad Mahmood Shah, Sheikh Khurram Abid, and Rubeena Tashfeen. "Risk Managing Technique in Pakistan Industry: A Case from Pakistan." Global Social Sciences Review, VII.II (2022): 463-478 Print.
-
OXFORD : Khan, Muhammad Mahmood Shah, Abid, Sheikh Khurram, and Tashfeen, Rubeena (2022), "Risk Managing Technique in Pakistan Industry: A Case from Pakistan", Global Social Sciences Review, VII (II), 463-478
-
TURABIAN : Khan, Muhammad Mahmood Shah, Sheikh Khurram Abid, and Rubeena Tashfeen. "Risk Managing Technique in Pakistan Industry: A Case from Pakistan." Global Social Sciences Review VII, no. II (2022): 463-478. https://doi.org/10.31703/gssr.2022(VII-II).45