
- Introduction
- The study focused on the practical use and implementation of efficiency in Pakistan. At present, mutual funds' efficiency is in Pakistan is determined by the use of parametric techniques like Capital Asset Pricing Model, Sharpe's ratio, and regression models (Afza & Rauf, 2009)
- However, internationally there has been a drift towards the use of non-parametric statistical technique for achieving the same. An important reason for this shift is due to several issues associated with the conventional parametric statistical techniques, which are in use from last six decades (Galagedera & Silvapulle, 2002).
- In the last six decades, many issues have surfaced and discussed about the parametric techniques. According to Fama and MacBeth (1973), the intercepts are found sometimes to be more than the RFR in some researches. More recently, issues of lower R-Square values were also discovered (Shehkar, Bhatnagar & Ramlogan, 2008).
- This study focuses on determining the efficiency of mutual funds using data envelopment analysis, a non-parametric efficiency determination technique fairly new in the field of investment finance. However, it has been quite successfully used around the globe in some of the most economically important financial markets like that of United States, Greece, and Australia (Babalos, Caporal & Philippas, 2009).
- Objectives of the Study
- The study aims to:
- Determine the relative efficiency standing of the mutual funds,
- Provide solution, in order to bring the inefficient mutual funds back to the efficiency frontier.
- Literature Review
- Evidences were found of a larger intercept than the RFR (Risk Free Rate)
- Evidences of a linear relationship were also found between the average return and the beta.
- Similarly, linear relationship was found to exist well in a data, which was collected for longer time periods.
- All the investors selected amongst different portfolios only on the basis of expected return and variance (risk) of a particular fund.
- Similarly, all the transaction costs as well as the taxes related to the funds were taken as zero.
- No need of normality assumptions. It's suitable for both normal and abnormal data.
- Robust model.
- No need of taking into consideration asymmetries or symmetries.
- Ability of handling large number of input and output variables.
- It provides the researcher with the efficient frontiers and exact solution to bring an inefficient portfolio back to the efficiency frontier.
- Analysis and Results
- Discussion
- Conclusion
Abstract
This study conducts a regression analysis between the efficiency scores and the explanatory variables. Data was collected for explanatory variables like age of the mutual fund, size of fund family, number of funds in funds family, and volatility (beta). As this study used input oriented model, mutual funds were categorized and relatively evaluated on the basis of similar outcomes and inputs charged. Out of 44 mutual funds understudy, only 7 of the mutual funds were cost efficient. This indicates that nearly 37 of the mutual funds under study have more costs associated to them as compared to the return they are offering to the investors. It has been safely assumed that all the mutual funds, which are below the efficiency frontier, should compare themselves with the industry benchmark efficient mutual funds. In order to make these inefficient mutual funds reach the optimum and higher efficiency score, the fund managers should check every input and determine the slack they can afford to reduce the input without reducing the output generating from it.
Keywords
Performance Evaluation, Mutual Funds, Data Envelopment Analysis
Hypothesis:
H0: The mutual fund is not efficient.
H1: The mutual fund is efficient.
Significance of the Study:
The study is significant for the portfolio managers working in mutual funds asset management companies. It will help them to use a much more robust market oriented technique to determine their own efficiency, as well as a comparison with their competitors and to check how close they are ranked with them. Moreover, an additional benefit of using DEA is that it notifies the user about the exact changes they need to make in order to bring a particular portfolio near to the efficiency frontier. On the other hand, an individual investor, if possesses a sound financial understanding, can also use this technique before taking any investment decision.
Mutual Funds have grown in to one of the most profitable and prospering investment domains in the previous century. Due to the flexibility, versatility and diversification effects of a mutual fund, it has become a sound option of investment in today's financial markets. The most compelling feature of investing in mutual fund portfolio is that, these are being handled by professional asset management companies, which invest in equity shares, debt securities as well as financial assets issued by government like T-bills etc. These professional asset management companies employ financial analysts, who monitor the risk prevailing in the market associated with the individual securities. They keep a balance of risk on the securities they handle within a particular portfolio. Mutual funds have seen a huge growth in the first world countries, and are also growing really quick in the third world countries now.
Among many mutual fund companies, every AMC claims to have the best and efficient management practices in the market. That is why; researchers from time to time have been interested in measuring the efficiency of the mutual funds (Nazir & Nawaz, 2010).
Pakistan's mutual fund market is also growing with a rapid pace. Mutual funds were introduced in Pakistan back in 1962 with the first IPO of NIT (National Investment Trust). At the moment, there are nearly 27 mutual fund asset management companies in Pakistan providing nearly 189 Mutual Funds with 142 open ended funds, 33 are Pension Funds, and 14 closed ended Mutual Funds. Just like the rest of the world, analysts as well as the researchers in Pakistan have also been indulged with determining efficiency of the Mutual Funds from time to time (Afza & Rauf, 2009).
Conventional Parametric Techniques for Measuring the Efficiency of Mutual Funds
Mutual Funds have been evaluated traditionally through parametric evaluative techniques and models. The ground breaking research was conducted back in 1960's by Jensen (1964), Sharpe (1964, 1966), Linter (1965), Treyner (1965) and Jenson (1968, 1969) using the different forms of the same model of Capital Asset Pricing Model. They used to develop a non-relative absolute measure of performance, in order to make evaluation of mutual funds easier. This helped in accessing the riskiness of the various assets (Pure Pricing Theory). However, this approach failed to incorporate the diversification effect, as it is one of the most important features of a mutual fund. If we take a look back towards the research work done by Markowtiz (1952), he found that a sudden change in the investment market leads to the inefficiency of the traditional indicators used for measuring future performance. Also, Jenson (1964) reported this evidence in another research, where he considered it to be minimizing the insurable risk born by the shareholders.
Similarly, Fama and Macbeth (1973) were also influenced by the "Two Parameter Portfolio Model." They were interested in testing the hypothesis that the pricing of the common stock reflects the actions & attempts of the risk averse investors to hold efficient portfolios. However, if only the researchers had used 3 factor or 4 factor models in this research, the results might have been different and more accurate. Vassilio, et al. (2012) also stressed on to propose a new and innovative evaluation measure for mutual funds in a multi-criteria decision making context. Similarly, Koulis, et al. (2011) tried to do some better work on mutual fund's risk and return apart from using CAPM with assumptions, which are still questionable by most of the modern researchers and practitioners.
Problems Associated with the Parametric Models
Shehkar, Bhatnagar and Ramlogan (2008) tried to provide a real life perspective of the Fama and French's work, as CAPM's effectiveness in real life is questionable. The findings in their research showed that "Three Factor Model" is definitely superior to the "Capital Asset Pricing Model" as CAPM and its split samples don't describe the value premium effects. Similarly, CAPM results in lower R square estimates with intercepts of regression having pricing errors. The problem is that the researchers here compared CAPM with a slightly newer version of an old 3 factor model, which may face the same issues related with CAPM once inputs become more complicated. Choudhary and Choudhary (2010) also tested the prediction of CAPM in the Indian Stock Market, whether the model holds true for the Indian market or not. However, they didn't find the model completely effective in the Indian market as higher risk (beta) isn't always associated with a higher level of return. According to Choudhary and Choudhary (2010), New York stock exchange during the time duration of 1931 to 1965 did report a linear relationship between the average excess portfolio's return and beta. However, for the portfolios with either low or high betas, the intercept was found to be both negative and positive accordingly. While continuing the work of Black, Jesnon and Scholes (1972), Fama and MacBeth (1973) highlighted certain evidences.
But most of the recent research studies provided weak and insignificant empirical evidences for these relationships (Fama & French, 1992). Similarly, Patton (2001) found skewness and asymmetric dependence to be widely reported to be present in most of the stock returns and is now considered to be the common feature of the stock returns. The presence of these asymmetries violated the assumption of proportionally distributed asset returns and linearity, which is required for mean variance analysis. This research showed a clear link between univariate skewness and asymmetric dependence between the assets, the latter can lead to skewed portfolios, an anomaly when the individual assets under study are not skewed themselves.
Similarly, one of the major problems associated with the CAPM and all the other parametric derivations of this model were of the basic assumptions that
Thus ignoring several costs related to a mutual fund provided the researchers with an over simplified picture and results about a mutual fund's efficiency. Zera and Madura (2010) found a negative relationship between fund expenses, and the fund size along with fund family size. They used a parametric OLS Regression model for determining the operational efficiency of the mutual funds, but an important point to note here is that they did incorporate the fund size, which wasn't taken in to consideration previously by most of the researchers using capital asset pricing model. Still they didn't include many other factors affecting the efficiency of a mutual fund like initial investment, individual expenses.
Barber, Odean and Zheng (2005) tried to find out that how investors treat various mutual fund expenses like front end loads, etc. as over the time, investors have become reluctant to pay the higher costs associated with a mutual fund. They found consistently negative relations between the front end load and the fund's flow. And no relation between fund flows and operating expenses, which seems to be unreliable. Hsu, Yang and Ou (2011) used six indicators and found two of them to be inefficient, the one which were derivate of capital asset pricing model, the classical parametric model. Similarly, costs were ignored in the simple mean variation analysis, which are actually considered a strong factor for mutual fund's efficiency evaluation process nowadays. Edelen and Kadlec, (1999) determined that Fund managers' trading costs were found to have a significantly and substantively negative association with the returns performance. And in most of the studies related to parametric modelling, we came across the same issue that costs and many other variables were not incorporated in the model, which along with the parametric modelling is another important issue that we face.
A Shift Towards Non Parametric Efficiency Determining Approaches
A new school of thought has emerged now with an objective to overcome, up to some extent the issues arising due to the usage of parametric techniques and models solely. Sengupta (2010) derived a non-parametric technique to measure the portfolio efficiency, by categorizing mutual funds for the different types they have like income funds, balanced funds and so forth. Chevalier, Glen and Ellison (1995) discussed a very important aspect of a mutual fund using a quite interesting semi-parametric model, where they studied the relationship between a mutual fund's performance and subsequent investment flows. Their research found that flow performance relationship is able to produce incentives for mutual fund companies, when one either increases or decreases the riskiness of their mutual fund portfolio. This study strengthens the usage of a combination of parametric and non-parametric models for studying and explaining important factors affecting Mutual Funds.
DEA also known as Data Envelopment Analysis is a fairly new, Non Parametric Technique that was in use in many other non-financial fields for determining the efficiency of the decision making units. However, it is now used in the field of finance, specifically for mutual funds efficiency determination. Bhagavath (2007) used Data Envelopment Analysis to determine the efficiency of "State Road Transport Undertakings" (STUs) using a new technique instead of simple regression and stochastic frontier analysis. Kumar and Allen (2010) argued that while using DEA for Fama-French Model, the problems of asset selection get easy to address using Fama-French three factor model; however, the OLS technique has some modelling problems. Empirical results show quite clearly that the assets selected through DEA approach perform much better when quantile estimates were being used. Mehragan and Golkan (2012), Basso & Funnari (2002), Galagedera & Silvapulle (2002), Babalos, Caporale & Philippas (2009), Lozano and Gutierrez (2007) and Penaraki (2012) have used Data Envelopment and different derived models of it for determining the efficiency of Mutual Funds in different countries with different sets of input and output variables. The comparatively significant features of Data Envelopment Analysis include:
In Pakistan, most of the research done in this sector is through using the same old-school parametric models and less attention is given to this fairly new non-parametric technique of "Data Envelopment Analysis". Previously, Afza and Rauf (2009), Nazir and Nawaz (2010) and many have used the same parametric techniques of Sharpe Ratio, Regression and so forth. We believe that Efficiency of Mutual Funds of Pakistan also requires to be tested with these fairly modern techniques, which offers many solutions to the issues related with the same old parametric techniques.
Findings from the Review
A lot of work has been done on the parametric models like capital asset pricing model, three factors model, sharp's ratio and so forth. However, with times, critiques have raised some valid points about the validity, reliability and accuracy of the results provided by these models. Some of these issues have been addressed using modified parametric models; however, some of the researchers had to use a semi-parametric approach to get better results. However, there have always been restrictions in following the assumptions, which may hinder the efforts put by the researchers. Nowadays, researchers are focusing on non-parametric techniques like date envelopment analysis. This robust model provides the researcher with the options of incorporating a lot of factors, which affect the efficiency of a Mutual Fund directly. In Pakistan, the focus has been strictly upon using the old conventional parametric techniques. However, no work has been done in Pakistan on Mutual Funds using this model. Therefore, I strongly believe that DEA can also be applied in the scenario of Pakistani Mutual Funds industry.
Methodology
The research methodology that is followed for collecting the data is a "Survey" of the secondary data already available on the website of MUFAP (mutual fund association of Pakistan. Survey was also used by Galagedara and Silvapulle (2002) for 257 Australian Mutual Funds. The rationale behind using the survey methodology is that the variables understudy is proxified using net asset values (daily NAVs) and the profits and costs that are associated with the mutual funds. All of this information is collected from mufap.com and from the respective websites and offices of the mutual fund companies.
Research Choice
The research choice for this particular research is mono-method. The reason behind it is the fact that this research study follows the quantitative approach right from the beginning of the data collection process through a survey of secondary data. Also, the model used is data envelopment analysis, which is again a non-parametric but quantitative model for efficiency analysis.
Description of Variables
The study uses the minimum initial investment, front end loads, backend loads, standard deviation and management fee of a Mutual Fund as the input variable for the model. For the output variables, the geometric mean of payoffs and the capital growth of a Mutual Fund are used. These are the very same variables used in the performance evaluation of Australian mutual funds through DEA by Galagedera and Silvapulle (2002). The criteria used for the selection both the Mutual Funds i.e. all those mutual funds, which have 5 years of daily NAV's available as well as their dividend payoffs in the last five years.
The first criterion is to test only the open ended Mutual Funds. The second criterion is to test only those open ended equity Mutual Funds which are at least five years old and their daily NAV's are also available, as the study covers the time period between 1st of July 2009 to 1st of July 2014. The second criteria for selection also includes availability of the information regarding the minimum initial investment, the initial investment cost or front end load, back-end loads or the redemption cost, and management fee. The reason behind not going for one-year data of NAVs is because most of the mutual funds are at the inception stage in the first year. Therefore, there is a chance that they might be offering excess return in the first year, in order to get more holders. That's why to obtain a clearer picture; one must have the time series data for at least three to five years. Also, it brings seasonality to the data, with lesser noise (stability) and periodicity. Hence, the effects of macroeconomic factors and changes are also incorporated and much clearer picture is visible in the long run.
Data Collection
The Sampling technique used here is the non-probability expert sampling. Five years of daily data is collected using the official website of Mutual Funds Association of Pakistan. The data of management fee, front end load, back end loads, and minimum investment capital requirement is collected from mutual funds' official websites and Bloomberg's database of Pakistan's mutual funds. The data collected for this research was secondary in nature. The reasons are that the research requires certain variables like the daily NAVs of the mutual funds understudy, loads, costs, management fee and returns from a certain mutual fund portfolio. All of the data about these variables is secondary in nature, and is readily available online.
Descriptive Variables
Table 1 presents the descriptive variables to be used for the study of Equity Based Mutual Funds.
Table 1.
Inputs | Outputs | |||||||
S. No | Company Name | Risk | FEL | BEL | MF | MII | Average Daily Return | Average Yearly Payout |
1 | ABL Stock Fund | 0.0300 | 2% | 0 | 3% | 5000 | 0.01074% | 0.23 |
2 | AKD Opportunity Fund | 0.0300 | 3% | 0 | 3% | 5000 | 0.03213% | 0.23 |
3 | Meezan Islamic Fund | 0.0300 | 2% | 0 | 2% | 5000 | 0.02883% | 0.1958 |
4 | Alfalah GHP Alpha Fund | 0.0136 | 3% | 0 | 2% | 5000 | 0.00569% | 0.0829 |
5 | Atlas Islamic Stock Fund | 0.0176 | 0% | 0 | 2% | 5000 | 0.00442% | 0.2085 |
6 | Atlas Stock Market Fund | 0.0167 | 0% | 0 | 2% | 5000 | 0.01801% | 0.1928 |
7 | HBL Stock Fund | 0.0327569 | 3% | 0 | 2% | 5000 | 0.02407% | 0.1373 |
8 | JS Growth Fund | 0.0120609 | 3% | 0 | 2% | 143.16 | 0.03460% | 0.0962 |
9 | JS Islamic Fund | 0.0182504 | 3% | 0 | 2% | 69.59 | 0.00932% | 0.2199 |
10 | JS Large Cap Fund | 0.0176152 | 3% | 0 | 2% | 69.59 | 0.01775% | 0.1609 |
11 | JS Value Fund | 0.0106413 | 3% | 0 | 2% | 81.3 | 0.03505% | 0.0740 |
12 | Crosby Dragon Fund | 0.0141402 | 2% | 0 | 2% | 10000 | 0.01358% | 0.1759 |
Table Continued on Next Page | ||||||||
Table Continued from Previous Page | ||||||||
13 | Pakistan Stock Market Fund | 0.0137242 | 2% | 0 | 2% | 5000 | 0.01890% | 0.1698 |
14 | Pakistan Strategic Allocation Fund | 0.0129076 | 2% | 0 | 2% | 10000 | 0.02192% | 0.1282 |
15 | National Investment Unit Trust | 0.0300058 | 3% | 0 | 1% | 5000 | 0.06460% | 0.0935 |
16 | NAFA Stock Fund | 0.0128538 | 3% | 0 | 2% | 10000 | 0.03793% | 0.0600 |
17 | PICIC Energy Fund | 0.0525249 | 3% | 0 | 2% | 5000.00 | 0.02000% | 0.1069 |
18 | Al Ameen Shariah Stock Fund | 0.0135374 | 3% | 0 | 2% | 500.00 | 0.01215% | 0.1548 |
19 | United Stock Advantage Fund | 0.020791 | 2% | 0 | 3% | 5000.00 | -0.02529% | 0.1551 |
20 | AKD Aggressive Income Fund | 0.0048892 | 1% | 0 | 2% | 50000.00 | 0.00458% | 0.0666 |
21 | Meezan Balanced Fund | 0.0092148 | 0% | 0 | 1% | 5000.00 | 0.02653% | 0.1067 |
22 | Alfalah GHP Islamic Fund | 0.0105517 | 3% | 0 | 2% | 5000.00 | -0.00010% | 0.0984 |
23 | Alfalah GHP Income Multiplier Fund | 0.0063565 | 3% | 0 | 1% | 10000 | -0.00493% | 0.0453 |
Table Continued on Next Page | ||||||||
Table Continued from Previous Page | ||||||||
24 | Askari Asset Allocation Fund | 0.0134616 | 2.5% | 2.5% | 2% | 5000 | -0.00611% | 0.1608 |
25 | Askari High Yield Scheme | 0.0041221 | 2% | 1% | 2% | 5000 | -0.00157% | 0.0107 |
26 | Askari Sovereign Cash Fund | 0.0030323 | 0% | 0% | 1% | 5000 | 0.00047% | 0.0111 |
27 | Atlas Income Fund | 0.0031805 | 0% | 0% | 1% | 5000 | 2.40510% | 0.024 |
28 | Atlas Islamic Income Fund | 0.0027293 | 0% | 0% | 1% | 5000 | 0.00043% | 0.0220 |
29 | Faysal Asset Allocation Fund | 0.0126371 | 3% | 0% | 2% | 5000 | 0.00894% | 0.1261 |
30 | Faysal Savings Growth Fund | 0.0030138 | 0% | 0% | 2% | 5000 | -0.00126% | 0.0170 |
31 | Faysal Income & Growth Fund | 0.0031326 | 1% | 0% | 2% | 5000 | 0.00253% | 0.0170 |
32 | Faysal Balanced Growth Fund | 0.012127 | 2% | 0% | 2% | 5000 | -0.02106% | 0.1585 |
33 | First Habib Income Fund | 0.0025777 | 0% | 0% | 2% | 5000 | -0.00010% | 0.0132 |
34 | HBL Income Fund | 0.0037558 | 0% | 0% | 2% | 5000 | 0.00570% | 0.0223 |
Table Continued on Next Page | ||||||||
Table Continued from Previous Page | ||||||||
35 | HBL Multi Asset Fund | 0.0001218 | 2% | 0% | 2% | 5000 | 0.01218% | 0.1536 |
36 | JS Aggressive Asset Allocation | 0.0243328 | 3% | 0% | 2% | 14.25 | -0.07592% | 0.4172 |
37 | JS Fund of Funds | 0.2463617 | 3% | 0% | 1% | 43.97 | -0.04405% | 0.2106 |
38 | JS Income Fund | 0.0036138 | 1% | 0% | 1% | 86.71 | -0.01141% | 0.0163 |
39 | JS KSE 30 Index Fund | 0.0378385 | 2% | 0% | 2% | 29.55 | 0.00718% | 0.1982 |
40 | Unit Trust of Pakistan | 0.0092988 | 3% | 0% | 1% | 132.74 | 0.02869% | 0.1022 |
41 | KASB Asset Allocation Fund | 0.010888 | 2% | 0% | 2% | 100000 | -0.00505% | 0.0418 |
42 | KASB Income Opportunity Fund | 0.0109835 | 0% | 0% | 1.30% | 100000 | -0.02789% | 0.0249 |
43 | KASB Islamic Income Opportunity Fund | 0.0033403 | 1% | 0% | 2% | 100000 | -0.00105% | 0.0160 |
44 | MCB Cash Management Optimizer | 0.0028239 | 0% | 0% | 10% | 100000 | -0.00003% | 0.0141 |
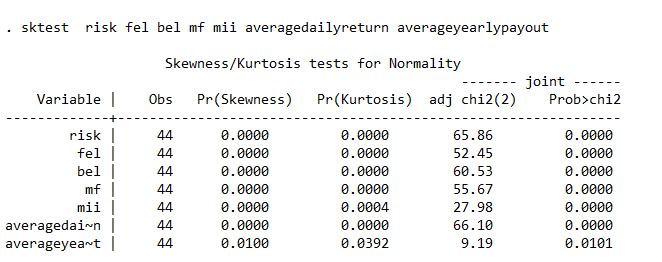
The study applied Jarque Bera test to determine normality of the variables used to find out efficiency scores. Since the P-Value of all the variables is less than level of significance that is 5%, it shows that the data in not normal. The study can safely use DEA for calculating the efficiency scores. This step was done in order to check the normality, which if not found makes the case of using DEA even stronger. Because in case of data being normal, we have a choice of using either data envelopment analysis or stochastic frontier analysis.
The minimum initial investment for every Mutual Fund is obtained from the official websites of the respective funds and from Bloomberg's database for Pakistani mutual fund. Same is done for the front end loads and management fees. The Standard Deviation is calculated through calculating the daily returns from the NAV's of the individual Mutual Funds for five years i.e. from July 1st 2009 to July 1st 2014. The Capital gains are also calculated using daily NAV's of the same time period. The daily returns are being added with a value of one and then the geometric mean is calculated for all the daily returns. After that, the value of one is subtracted from the geometric mean and the residual value is the capital gain for the particular fund. For dividend pay-outs, geometric mean is again used to calculate 5 years' average dividend playout. For those mutual funds, which provide playout multiple times a year, each year's average pay-outs calculated separately by geometric mean and then 5 years' geometric mean is calculated with the help of each year's final value.
Technique Applied
For conducting this study, a non-parametric technique of Data Envelopment Analysis is used for determining the relative efficiency of Mutual Funds. The specific model of Data Envelopment Analysis used for the study is Input Oriented BCC Model. In an Input-Oriented model, the calculations done are focused towards the efficiency of a Mutual Fund's input variables. This model provides us with an efficiency score theta and benchmark lambda, which is a reference statistic used to bring back the inefficient mutual funds near to the efficiency level of 100%.
The efficiency scores identify whether, the Mutual Fund is relatively efficient to its peers or not.
Below mentioned are efficiency scores obtained by running the input oriented BCC model of data envelopment analysis on Table 1.0.
Table 2.
S. No. | DMU | Theta |
1 | ABL Stock Fund | 50.00% |
2 | AKD Aggressive Income Fund | 66.00% |
3 | AKD Opportunity Fund | 44.00% |
4 | Al Ameen Shariah Stock Fund | 66.00% |
5 | Alfalah GHP Alpha Fund | 29.00% |
6 | Alfalah GHP Income Multiplier Fund | 21.00% |
7 | Alfalah GHP Islamic Fund | 34.00% |
8 | Askari Asset Allocation Fund | 56.00% |
9 | Askari High Yield Scheme | 6.00% |
10 | Askari Sovereign Cash Fund | 46.00% |
11 | Atlas Income Fund | 100.00% |
12 | Atlas Islamic Income Fund | 91.00% |
13 | Atlas Islamic Stock Fund | 100.00% |
14 | Atlas Stock Market Fund | 92.00% |
15 | Crosby Dragon Fund | 67.00% |
16 | Faysal Asset Allocation Fund | 44.00% |
17 | Faysal Balanced Growth Fund | 61.00% |
18 | Faysal Income & Growth Fund | 19.00% |
19 | Faysal Savings Growth Fund | 70.00% |
20 | First Habib Income Fund | 54.00% |
21 | HBL Income Fund | 92.00% |
22 | HBL Multi Asset Fund | 100.00% |
23 | HBL Stock Fund | 33.00% |
24 | JS Aggressive Asset Allocation | 100.00% |
25 | JS Fund of Funds | 100.00% |
26 | JS Growth Fund | 52.00% |
27 | JS Income Fund | 100.00% |
28 | JS Islamic Fund | 52.00% |
29 | JS KSE 30 Index Fund | 73.00% |
30 | JS Large Cap Fund | 60.00% |
31 | JS Value Fund | 92.00% |
32 | KASB Asset Allocation Fund | 16.00% |
33 | KASB Income Opportunity Fund | 23.00% |
34 | KASB Islamic Income Opportunity Fund | 15.00% |
35 | MCB Cash Management Optimizer | 5.00% |
36 | Meezan Balanced Fund | 100.00% |
37 | Meezan Islamic Fund | 56.00% |
38 | NAFA Stock Fund | 21.00% |
39 | National Investment Unit Trust | 47.00% |
40 | Pakistan Stock Market Fund | 65.00% |
41 | Pakistan Strategic Allocation Fund | 49.00% |
42 | PICIC Energy Fund | 25.00% |
43 | Unit Trust of Pakistan | 50.00% |
44 | United Stock Advantage Fund | 42.00% |
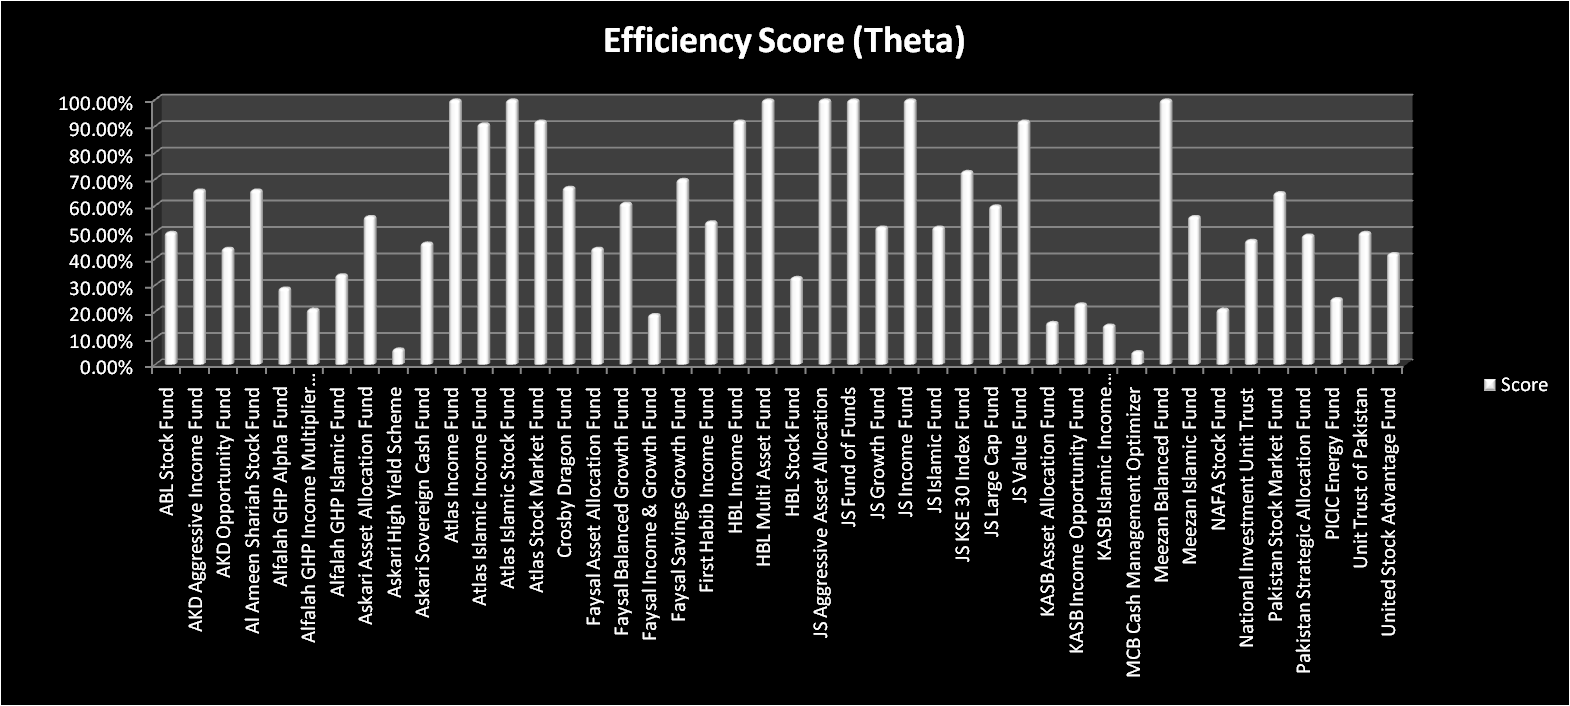
Figure: 1.
It is clear from the chart that except for Atlas Income Fund, Atlas Islamic Stock Fund, HBL Stock Fund, JS Income Fund, Meezan Balanced Fund, JS Funds of Funds and HBL Multi asset funds, all the rest of 37 mutual funds are below the efficiency level of 100%. The above mentioned 7 mutual funds are the ones currently at 100% level of efficiency providing maximum output as compared to the inputs. Below mentioned is the table of frequencies depicting the efficiency ranges having maximum number of inefficient units.
Table 3.
Ranges | Frequency |
up to 0.10 | 2 |
0.10+ to 0.20 | 3 |
0.20+ to 0.30 | 5 |
0.30+ to 0.40 | 2 |
0.40+ to 0.50 | 6 |
0.50+ to 0.60 | 7 |
0.60+ to 0.70 | 6 |
0.70+ to 0.80 | 2 |
0.80+ to 0.90 | 0 |
0.90+ to 1.00 | 4 |
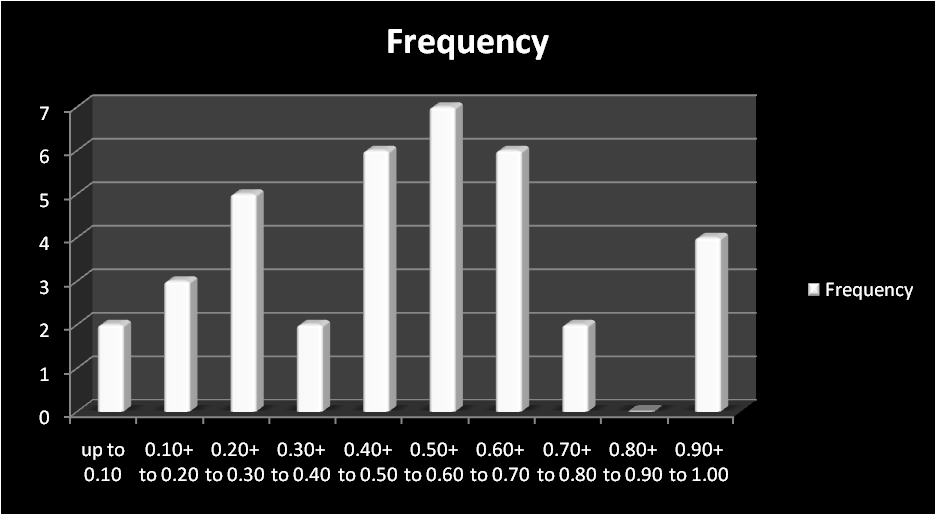
This frequency table shows that maximum number of inefficient mutual funds have efficiency score ranging from 40% to 70%. This can also be observed in the graph mentioned below.
Apart from the efficiency score, we also get benchmark lambdas in our test results. These statistics are the relative efficiency score and by using these, a fund can reach the highest optimum level of efficiency.
Table 4.
S. No. | DMU | Benchmark (Lambda) |
| 1 | ABL Stock Fund | Atlas Income Fund(0.002015); Atlas Islamic Stock Fund(0.339921); JS Aggressive Asset Allocation(0.338955); Meezan Balanced Fund(0.165531) |
| 2 | AKD Aggressive Income Fund | Atlas Income Fund(0.660243); HBL Multi Asset Fund(0.330122) |
| 3 | AKD Opportunity Fund | Atlas Income Fund(0.008620); Atlas Islamic Stock Fund(0.001255); JS Aggressive Asset Allocation(0.440415); Meezan Balanced Fund(0.429284) |
| 4 | Al Ameen Shariah Stock Fund | Atlas Income Fund(0.004797); HBL Multi Asset Fund(0.050734); JS Aggressive Asset Allocation(0.330458); JS Income Fund(0.554650) |
| 5 | Alfalah GHP Alpha Fund | Atlas Income Fund(0.001635); HBL Multi Asset Fund(0.144562); JS Aggressive Asset Allocation(0.145380) |
| 6 | Alfalah GHP Income Multiplier Fund | JS Aggressive Asset Allocation(0.108542) |
| 7 | Alfalah GHP Islamic Fund | HBL Multi Asset Fund(0.172376); JS Aggressive Asset Allocation(0.172376) |
| 8 | Askari Asset Allocation Fund | HBL Multi Asset Fund(0.281750); JS Aggressive Asset Allocation(0.281750) |
| 9 | Askari High Yield Scheme | HBL Multi Asset Fund(0.069806) |
| 10 | Askari Sovereign Cash Fund | Atlas Income Fund(0.461939) |
| 11 | Atlas Income Fund | Atlas Income Fund(1.000000) |
| 12 | Atlas Islamic Income Fund | Atlas Income Fund(0.914744) |
| 13 | Atlas Islamic Stock Fund | Atlas Islamic Stock Fund(1.000000) |
| 14 | Atlas Stock Market Fund | Atlas Income Fund(0.005791); Atlas Islamic Stock Fund(0.924006) |
Table Continued on Next Page
Table Continued from Previous Page
| 15 | Crosby Dragon Fund | Atlas Income Fund(0.339465); HBL Multi Asset Fund(0.169732); JS Aggressive Asset Allocation(0.339465) |
| 16 | Faysal Asset Allocation Fund | Atlas Income Fund(0.002605); HBL Multi Asset Fund(0.219777); JS Aggressive Asset Allocation(0.221079) |
| 17 | Faysal Balanced Growth Fund | Atlas Income Fund(0.305967); HBL Multi Asset Fund(0.152984); JS Aggressive Asset Allocation(0.305967) |
| 18 | Faysal Income & Growth Fund | Atlas Income Fund(0.095931); HBL Multi Asset Fund(0.095931) |
| 19 | Faysal Savings Growth Fund | Atlas Income Fund(0.708626) |
| 20 | First Habib Income Fund | Atlas Income Fund(0.547029) |
| 21 | HBL Income Fund | Atlas Income Fund(0.927887) |
| 22 | HBL Multi Asset Fund | HBL Multi Asset Fund(1.000000) |
| 23 | HBL Stock Fund | Atlas Income Fund(0.010006); JS Aggressive Asset Allocation(0.323527); JS Fund of Funds(0.010006) |
| 24 | JS Aggressive Asset Allocation | JS Aggressive Asset Allocation(1.000000) |
| 25 | JS Fund of Funds | JS Fund of Funds(1.000000) |
| 26 | JS Growth Fund | Atlas Income Fund(0.014386); JS Aggressive Asset Allocation(0.229676) |
| 27 | JS Income Fund | JS Income Fund(1.000000) |
| 28 | JS Islamic Fund | Atlas Income Fund(0.003875); JS Aggressive Asset Allocation(0.526810); JS Fund of Funds(0.000161) |
| 29 | JS KSE 30 Index Fund | Atlas Income Fund(0.002983); JS Aggressive Asset Allocation(0.474798) |
| 30 | JS Large Cap Fund | Atlas Income Fund(0.007382); JS Aggressive Asset Allocation(0.385207) |
| 31 | JS Value Fund | Atlas Income Fund(0.014572); JS Aggressive Asset Allocation(0.176635) |
Table Continued on Next Page | ||
Table Continued from Previous Page | ||
| 32 | KASB Asset Allocation Fund | Atlas Income Fund(0.080769); HBL Multi Asset Fund(0.040385); JS Aggressive Asset Allocation(0.080769) |
| 33 | KASB Income Opportunity Fund | Meezan Balanced Fund(0.233474) |
| 34 | KASB Islamic Income Opportunity Fund | Atlas Income Fund(0.158378); HBL Multi Asset Fund(0.079189) |
| 35 | MCB Cash Management Optimizer | Atlas Income Fund(0.584493) |
| 36 | Meezan Balanced Fund | Meezan Balanced Fund(1.000000) |
| 37 | Meezan Islamic Fund | Atlas Income Fund(0.007939); JS Aggressive Asset Allocation(0.375012); Meezan Balanced Fund(0.367073) |
| 38 | NAFA Stock Fund | Atlas Income Fund(0.015271); HBL Multi Asset Fund(0.098881); JS Aggressive Asset Allocation(0.106517) |
| 39 | National Investment Unit Trust | Atlas Income Fund(0.026858); JS Aggressive Asset Allocation(0.202078); JS Fund of Funds(0.040404) |
| 40 | Pakistan Stock Market Fund | Atlas Income Fund(0.327714); HBL Multi Asset Fund(0.163857); JS Aggressive Asset Allocation(0.327714) |
| 41 | Pakistan Strategic Allocation Fund | Atlas Income Fund(0.247385); HBL Multi Asset Fund(0.123693); JS Aggressive Asset Allocation(0.247385) |
| 42 | PICIC Energy Fund | Atlas Income Fund(0.008316); JS Aggressive Asset Allocation(0.251588); JS Fund of Funds(0.008316) |
| 43 | Unit Trust of Pakistan | Atlas Income Fund(0.011927); JS Aggressive Asset Allocation(0.244135); JS Fund of Funds(0.000497) |
| 44 | United Stock Advantage Fund | Atlas Income Fund(0.283617); Atlas Islamic Stock Fund(0.142214); JS Aggressive Asset Allocation(0.284428) |
This table represents the relative Benchmark lambdas for every single mutual fund except the ones that are efficient. If we have a look at the first mutual fund i.e. ABL Stock Fund, it has an efficiency score of 50%. The benchmark lambdas mentioned in the next column are of the efficient mutual funds, which are closest to ABL Stock Fund in terms of inputs and outputs. Every percentage mentioned with a benchmark mutual fund is a statistic, which if multiplied with the inputs of the very same benchmark lambdas they belong too will produce a smaller number of it. Once repeated for every single benchmark inputs and outputs, we will get separate inputs and outputs. These new inputs and outputs once added together will give us the same output level with rectified input variable numbers which would be nearly 100% efficient.
Out of 44 mutual funds understudy, only 7 of the mutual funds were cost efficient. This indicates that nearly 37 of the mutual funds under study have more costs associated to them as compared to the return they are offering to the investors. As this is an input oriented model, mutual funds are categorized and relatively evaluated on the basis of similar outcomes and inputs charged. Therefore, we safely assume that all the mutual funds, which are below the efficiency frontier, should compare themselves with the industry benchmark efficient mutual funds. In order make these inefficient mutual funds reach the optimum and higher efficiency score, the fund managers should check every input and determine the slack they can afford to reduce the input without reducing the output generating from it.
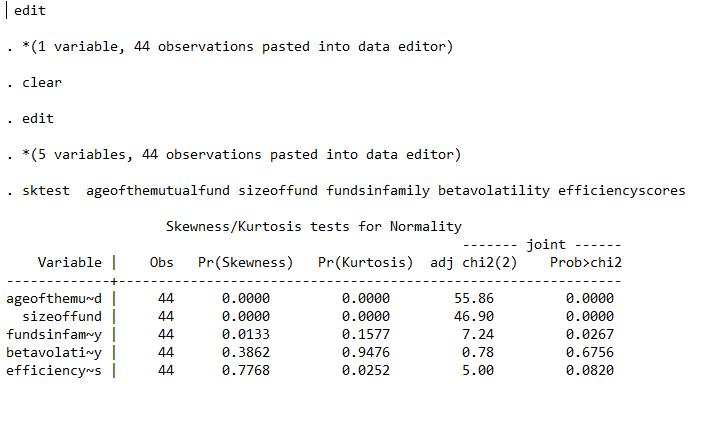
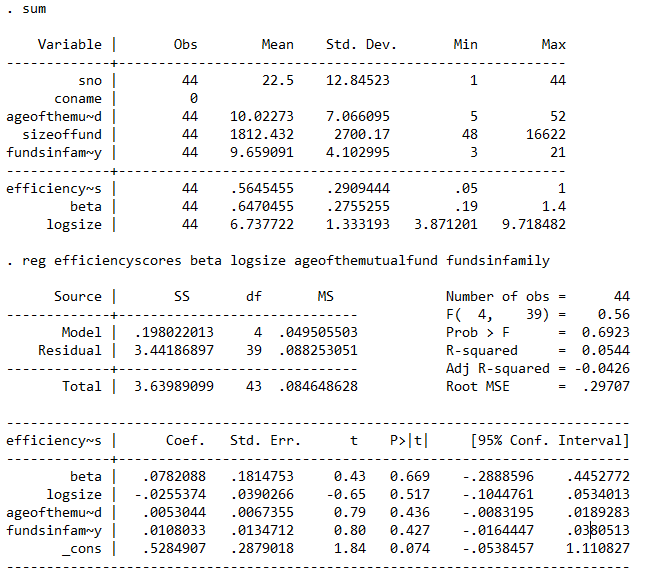
The study also tried to conduct a regression analysis between the efficiency scores and the explanatory variables. Data was collected for explanatory variables like age of the mutual fund, size of fund family, number of funds in funds family, and volatility (beta). However, the data was not normal and even after transformation; the data was not able to be normalized. Only beta, the proxy for volatility was normal. Efficient score was abnormal at 10% and rests of the variables were abnormal at all levels. And as per the conditions of regression, first condition is that data should be normal. Upon forcing the regression test on non-normal data, all the values in the output of regression were insignificant as shown from the P-Values. Such a situation is hardly possible in real life as explanatory variables should have some sort of an effect as proved by Galagedera and Silvapulle (2002). A main reason for abnormality could be the smaller sample size.
Most of the mutual funds under study have more costs associated to them as compared to the return they are offering to the investors. It has been safely assumed that all the mutual funds, which are below the efficiency frontier, should compare themselves with the industry benchmark efficient mutual funds. In order to make these inefficient mutual funds reach the optimum and higher efficiency score, the fund managers should check every input and determine the slack they can afford to reduce the input without reducing the output generating from it.
Appendix
Normality Test Results for Efficiency Tests.
Normality Test Results for Explanatory Variables:
Forced Regression Results on Abnormal Data
References
- Afza, T., & Rauf, A. (2009). Performance Evaluation of Pakistani Mutual Funds.
- Pakistan Economic and Social Review, 47(2), 199-214.
- Bhatnagar, C. S., & Ramlogan, R. (2012). The capital asset pricing model versus the three factor model: A United Kingdom Perspective. International Journal of Business and Social Research, 2(1), 51-65.
- Bhagavath, V. (2006). Technical efficiency measurement by data envelopment analysis: an application in transportation. Alliance Journal of Business Research, 2(1), 60-72.
- Basso, A., & Funari, S. (2003). Measuring the performance of ethical mutual funds: A DEA approach. Journal of the Operational Research Society, 54(5), 521-531.
- Babalos, V., Philippas, N., Doumpos, M., & Zopounidis, C. (2012). Mutual funds’performance appraisal using stochastic multi-criteria acceptability analysis. Applied Mathematics and Computation, 218(9), 5693-5703.
- Barber, B., Odean, T., & Zheng, L. (2004). Out of sight, out of mind: The effects of expenses on mutual fund flows. Out of Mind: The Effects of Expenses on Mutual Fund Flows, (December).
- Chaudhary, K., & Chaudhary, S. (2010). Testing Capital Asset Pricing Model: Empirical Evidences from Indian Equity Market. Eurasian Journal of Business and Economics, 3(6), 127-138.
- Cooper, W.W., Seiford, L.M., & Zhu, J. (2004) Data Envelopment Analysis: History, Models and Interpretations. Unpublished manuscript, University of Texas, Austin, Texas.
- Chalmers, J., Edelen, R., & Kadlec, G. (1999). An analysis of mutual fund trading costs. Available at SSRN 195849.
- Chevalier, J. A., & Ellison, G. D. (1995). Risk taking by mutual funds as a response to incentives (No. w5234). National Bureau of Economic Research.
- Fama, E.F. & MacBeth, J.D. (1973). Risk, Return and Equilibrium: Empirical Tests. The Journal of Political Economy, 81(3), 607-636.
- Galagedera, D. U. A. & Silvapulle. P. (2002). Australian Mutual Fund Performance Appraisal using Data Envelopment Analysis. Emerald article Managerial Finance, 28 (9), 60 – 73.
- Hsu, L. C., Ou, S. L., Yang, C. C., & Ou, Y. C. (2012). How to Choose Mutual Funds that Perform Well? Evidence from Taiwan. International Journal of Economics and Finance, 4(1), p247.
- Jensen, M.C. (1967). The Performance of Mutual Funds in the Period 1945-1964. The Journal of Finance, 23(2), 389-416.
- Jensen, M., & Scholes, M. (1972). The capital asset pricing model: Some empirical tests.
- Koulis, A., Beneki, C., Adam, M., & Botsaris, C. (2011). An Assessment of the Performance of Greek Mutual Equity Funds Selectivity and Market Timing. Applied Mathematical Sciences, 5(4), 159-171.
- Lintner, J. (1965). The valuation of risk assets and the selection of risky investments in stock portfolios and capital budgets. The review of economics and statistics, 47(1), 13-37.
- Markowitz, H. (1952). Portfolio selection*. The journal of finance, 7(1), 77-91.
- Nazir, M. S., & Nawaz, M. M. (2010). The Determinants of Mutual Fund Growth in Pakistan. International Research Journal of Finance and Economics, (54)
- Patton, A.J. (2001). On the Out-of-Sample Importance of Skewness and Asymmetric Dependence for Asset Allocation (Unpublished manuscript). London: London School of Economics.
- Pendaraki, K. (2012). Mutual Fund Performance Evaluation using Data Envelopment Analysis with Higher Moments. Journal of Applied Finance & Banking, 2(5),97-112.
- Singh, A. K., & Allen, D. E. (2010). Asset Selection Using a Factor Model and Data Envelopment Analysis. A Quantile Regression Approach
- ( Unpublished manuscript). Joondalup: Edith Cowan University, Joondalup.
- Sengupta, J. K. (2003). Efficiency tests for mutual fund portfolios. Applied Financial Economics, 13(12), 869-876.
- Tehrani, R., Mehragan, M, R. & Goldani, M, R. (2012). A Model for Evaluating Financial Performance of Companies by Data Envelopment Analysis [Electronic Version]. International Business Research, 5(8), 8-16
- Zera, S. P., & Madura, J. (2001). The empirical relationship between mutual fund size and operational efficiency. Applied Financial Economics, 11(3), 243-251.
Cite this article
-
APA : Bangash, R., Hussain, A., & Azhar, M. H. (2018). Performance Evaluation of Mutual Funds: A Data Envelopment Analysis. Global Social Sciences Review, III(II), 212-236. https://doi.org/10.31703/gssr.2018(III-II).14
-
CHICAGO : Bangash, Romana, Arif Hussain, and Muhammad Hassan Azhar. 2018. "Performance Evaluation of Mutual Funds: A Data Envelopment Analysis." Global Social Sciences Review, III (II): 212-236 doi: 10.31703/gssr.2018(III-II).14
-
HARVARD : BANGASH, R., HUSSAIN, A. & AZHAR, M. H. 2018. Performance Evaluation of Mutual Funds: A Data Envelopment Analysis. Global Social Sciences Review, III, 212-236.
-
MHRA : Bangash, Romana, Arif Hussain, and Muhammad Hassan Azhar. 2018. "Performance Evaluation of Mutual Funds: A Data Envelopment Analysis." Global Social Sciences Review, III: 212-236
-
MLA : Bangash, Romana, Arif Hussain, and Muhammad Hassan Azhar. "Performance Evaluation of Mutual Funds: A Data Envelopment Analysis." Global Social Sciences Review, III.II (2018): 212-236 Print.
-
OXFORD : Bangash, Romana, Hussain, Arif, and Azhar, Muhammad Hassan (2018), "Performance Evaluation of Mutual Funds: A Data Envelopment Analysis", Global Social Sciences Review, III (II), 212-236
-
TURABIAN : Bangash, Romana, Arif Hussain, and Muhammad Hassan Azhar. "Performance Evaluation of Mutual Funds: A Data Envelopment Analysis." Global Social Sciences Review III, no. II (2018): 212-236. https://doi.org/10.31703/gssr.2018(III-II).14